Overview
- 연구 배경: 뇌의 구조와 기능을 이해하기 위한 영상 기법의 중요성 증대, 특히 구조 영상(CT, MRI)과 기능 영상(fMRI, PET)의 차이점 및 활용 가능성 분석
- 핵심 방법론:
- 구조 영상: 뼈, 회백질, 백질 등 조직의 물리적 특성 기반으로 정적 뇌 구조 맵 생성 (CT, MRI)
- 기능 영상: 신경 활동에 따른 혈류 및 산소 농도 변화를 측정 (fMRI의 BOLD 신호, PET의 방사성 추적제 활용)
- 고급 분석 기법: VBM(voxel-based morphometry)을 통한 회백질/백질 밀도 분석, DTI(diffusion tensor imaging)를 통한 백질 연결성 측정 (분수 이방성 FA 지표 활용)
- 주요 기여:
- fMRI의 혈동학적 반응 함수(HRF)의 3단계 변화(초기 감소, 과보상, 부족 회복)를 기반으로 한 신경 활동 해석 프레임워크 제시
- DTI를 통한 피아노 연주 학습이 뇌 백질 구조에 미치는 영향 (유아기, 청소년기, 성인기별 차이)
- 실험 결과:
- Bengtsson 등(2005) 연구에서 피아노 연주 학습 시 특정 백질 섬유의 발달 증가 관찰 (연령대별로 다른 섬유 영향)
- fMRI의 공간 해상도 1mm, 시간 해상도 1~4초로 PET(10mm, 30초) 대비 우수한 성능 기록
- 한계점: fMRI의 혈동학적 간접 측정 한계로 인한 신경 활동 직접 측정 불가, 시간 해상도 개선 필요 및 특정 뇌 영역(예: 부비동 주변) 영상화 어려움
📋 목차
대단원 구조
- Chapter 4 The imaged brain — 기능적 뇌 영상의 개요 및 장(章) 소개
- Structural Imaging — 구조적 영상 기법
- 2.1 Computerized tomography — 컴퓨터 단층 촬영(CT)
- 2.2 Magnetic resonance imaging — 자기공명영상(MRI)
- 2.3 MRI physics for non-physicists — 비물리학자를 위한 MRI 물리학
- Functional Imaging — 기능적 영상 기법
- 3.1 Basic physiology underpinning functional imaging — 기능적 영상의 생리학적 기초
- 3.2 Positron emission tomography — 양전자 방출 단층 촬영(PET)
- 3.3 Functional magnetic resonance imaging — 기능적 자기공명영상(fMRI)
- From Image to Cognitive Theory: Experimental Design — 영상에서 인지 이론으로: 실험 설계
- 4.1 An example of cognitive subtraction methodology — 인지 차감 방법론의 예시
- 4.2 Problems with cognitive subtraction — 인지 차감의 문제점
- 4.3 Cognitive conjunctions and factorial designs — 인지 결합과 요인 설계
- 4.4 Parametric designs — 파라메트릭 설계
- 4.5 Functional integration — 기능적 통합
- Safety and Ethical Issues in Functional Imaging Research — 기능적 영상 연구의 안전 및 윤리 문제
- Analyzing Data from Functional Imaging — 기능적 영상 데이터 분석
- 6.1 Correction for head movement — 머리 움직임 보정
- 6.2 Stereotactic normalization — 스테레오타크틱 정규화
- 6.3 Smoothing — 스무딩
- 6.4 Statistical comparison — 통계적 비교
- Interpreting Data from Functional Imaging — 기능적 영상 데이터 해석
- 7.1 Inhibition versus excitation — 억제 대 흥분
- 7.2 Activation versus deactivation — 활성화 대 비활성화
- 7.3 Necessity versus sufficiency — 필수성 대 충분성
- Why Do Functional Imaging Data Sometimes Disagree with Lesion Data? — 기능적 영상과 손상 데이터의 불일치
- 8.1 Having your cake and eating it — 두 마리 토끼 잡기: 세마틱 메모리 사례
Chapter 4 The imaged brain
Summary
이 장은 fMRI를 중심으로 기능적 뇌 영상 기법의 작동 원리, 실험 설계, 데이터 분석 및 해석 방법을 다룬다. 구조적 영상(CT, MRI)과 기능적 영상(fMRI, PET)의 차이, 인지 이론과의 연결 방법, 그리고 활성화 영역 분석 시 발생할 수 있는 해석상의 함정을 논의한다. 또한 뇌 독서(brain-reading) 기술의 가능성과 윤리적 한계를 비판적으로 탐구한다.
If George Orwell had wrien Nineteen Eighty-four during our times, would he have put an MRI scanner in the Ministry of Truth? Could we ever really know the content of someone else’s thoughts using functional imaging tenology? is apter will consider how functional imaging methods work, focusing in particular on fMRI (functional magnetic resonance imaging). is apter is broadly divided into three parts. e first part considers how functional and structural brain imaging works, with
particular reference to underlying neurophysiology. e second part considers methodological factors that are important in ensuring that the results obtained can indeed be meaningfully linked to cognitive theory. e third part covers how functional imaging data are analyzed to find regions of activation and considers some of the pitfalls in their interpretation. Finally, the apter returns to the question of whether functional imaging could be used as an Orwellian-like mind reader.
Structural Imaging
Summary
구조적 영상은 두개골, 회백질, 백질 등 뇌 조직의 물리적 특성을 활용하여 정적 구조 지도를 생성하며, 대표적으로 CT와 MRI가 있다. 반면 기능적 영상은 신경 활동에 따른 국소적 생리 변화를 측정하여 인지 과제 수행 시 뇌의 동적 활동 지도를 제공한다.
One key distinction is the difference between structural imaging methods and functional imaging methods. Structural imaging is based on the fact that different types of tissue (e.g. skull, gray maer, white maer, cerebrospinal fluid) have different physical properties. ese different properties can be used to construct detailed static maps of the physical structure of the brain. e most common structural imaging methods are computerized tomography (CT) and magnetic resonance imaging (MRI). Functional imaging is based on the assumption that neural activity produces local physiological anges in that region of the brain. is can be used to produce dynamic maps of the moment-to-moment activity of the brain when engaged in cognitive tasks.
Key Terms
Summary
구조적 영상은 뇌 내 회백질, 백질, 뇌척수액 등 다양한 조직의 공간적 배열을 CT와 MRI로 측정하는 방법론이다. 특히 MRI는 높은 해상도로 조직의 세부 구조를 정량적으로 분석할 수 있어, 기능적 영상과 대비되는 정적 해부학적 정보를 제공한다.
Structural imaging
Measures of the spatial configuration of different types of tissue in the brain (principally CT and MRI).
구조적 영상은 뇌 조직의 **공간적 배열**을 측정하는 방법으로, CT와 MRI가 대표적이다. MRI는 높은 해상도로 회백질과 백질을 구분하여 정적 해부학적 정보를 제공한다.
Functional imaging
Measures temporary anges in brain physiology associated with cognitive processing; the most common method is fMRI and is based on a hemodynamic measure.
기능적 영상은 인지 처리에 따른 뇌의 일시적 생리 변화를 측정하며, fMRI가 대표적으로 **혈류 변화**를 기반으로 작동한다. 구조적 영상이 정적 구조를 보여주는 것과 달리, 동적 신경 활성화 패턴을 탐구한다.
Computerized tomography
Summary
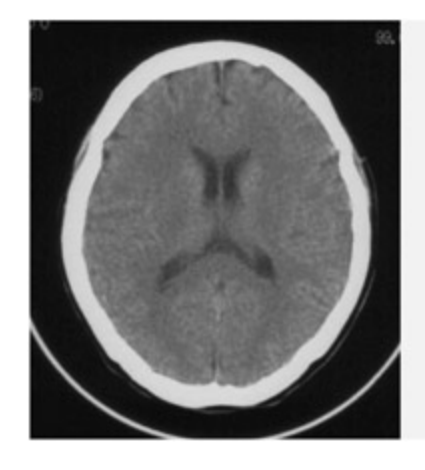
CT는 X선 흡수량에 따라 조직 밀도를 영상화하며, 골격은 흰색, 뇌척수액은 검은색, 뇌질은 회색으로 표시된다. 주로 종양이나 출혈 진단에 사용되나, MRI와 달리 회백질과 백질을 구분하지 못하고 기능적 영상에는 부적합하다.
Computerized tomography (CT) scans are constructed according to the amount of X-ray absorption in different types of tissue. e amount of absorption is related to tissue density: bone absorbs the most (and so the skull appears white), cerebrospinal fluid absorbs the least (so the ventricles appear bla), and the brain maer is intermediate (and appears gray). Given that CT uses X-rays, the person being scanned is exposed to a small amount of radiation.
CT scans are typically used only in clinical seings, for example to diagnose tumors or to identify hemorrhaging or other gross brain anomalies. CT cannot distinguish between gray maer and white maer in the same way as MRI, and it cannot be adapted for functional imaging purposes.
시험 팁
CT와 MRI를 비교할 때 핵심 차이 3가지를 기억하자: (1) CT는 X선(방사선 노출), MRI는 자기장(방사선 없음), (2) CT는 회백질/백질 구분 불가, MRI는 가능, (3) CT는 기능적 영상 불가, MRI는 fMRI로 확장 가능. 시험에서 “CT의 장점”을 묻는다면, 빠른 촬영 시간과 급성 출혈/골절 진단에 유리하다는 점을 떠올리자.
Magnetic resonance imaging
Summary
MRI는 방사선 없이 반복 검사가 가능하고 공간 해상도가 CT보다 우수하여 회백질과 백질을 명확히 구분할 수 있다. 2003년 노벨상을 수상한 기술로, fMRI로 확장 시 혈액 산소 농도 변화를 측정하여 신경 활성화를 분석할 수 있다.
📊 그림 설명
컴퓨터 단층 촬영(CT) 뇌 스캔 이미지이다. X선 흡수량에 따라 뼈(두개골)는 흰색, 뇌척수액(뇌실)은 검은색, 뇌 조직은 회색으로 나타난다. CT는 종양이나 출혈 진단에 주로 사용되지만, 회백질과 백질을 구분하지 못하는 한계가 있다.
📊 그림 설명
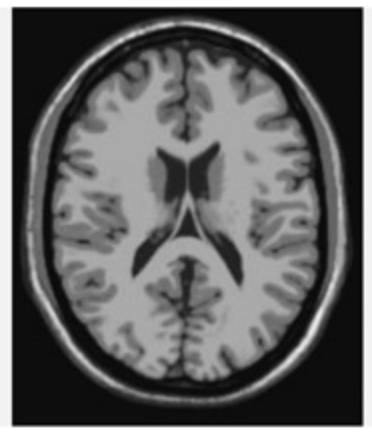
T1-가중 MRI 뇌 스캔 이미지이다. CT에 비해 공간 해상도가 우수하여 회백질(회색)과 백질(밝은 색)을 명확히 구분할 수 있다. T1-가중 영상은 주로 구조적 뇌 영상에 사용되며, 뇌 주름(이랑)의 세부 구조까지 식별할 수 있다.
📊 그림 설명
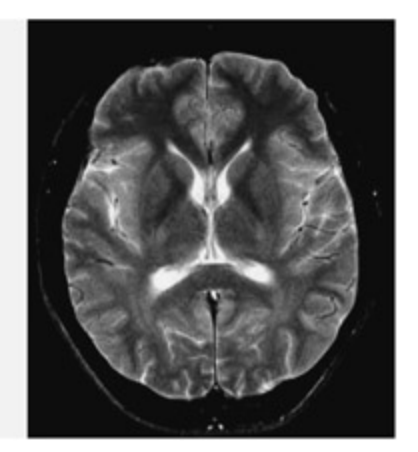
T2-가중 MRI 뇌 스캔 이미지이다. T1-가중 영상과 달리 조직의 T2 이완 시간 차이를 반영하며, 뇌척수액이 밝게 나타나는 특징이 있다. T2* 성분은 탈산소화 헤모글로빈에 민감하여 fMRI의 BOLD 신호 측정의 기초가 된다.
An example of CT (le), T1-weighted MRI (center), and T2-weighted MRI (right) scans of the brain. Note how the MRI scans are able to distinguish between gray maer and white maer. On the T1 weighted scan (normally used for structural images), gray maer appears gray and white maer appears lighter.
Magnetic resonance imaging (MRI) was one of the most important advances in medicine made during the twentieth century. Its importance was recognized by the awarding of the 2003 Nobel Prize to its inventors—Sir Peter Mansfield and Paul Lauterbur. ere are a number of advantages of this method over CT scanning, as summarized below:
- It does not use ionizing radiation and so is completely safe (people can be scanned many times).
- It provides a mu beer spatial resolution, whi allows the folds of individual gyri to be discerned.
- It provides beer discrimination between white maer and gray maer; this may enable early diagnosis of some pathologies, and can be used to explore how normal variation brain structure is linked to differences in cognitive ability.
- It can be adapted for use in detecting the anges in blood oxygenation associated with neural activity, and in this context is called functional MRI (fMRI).
MRI vs. fMRI — 한눈 비교
핵심 구분: MRI는 같은 하드웨어로 두 종류의 영상을 찍는 기술 — “무엇을 가중치로 둘 것인가(T1 vs T2*)“와 “한 번 찍느냐, 반복 찍느냐”의 차이다. 즉 fMRI는 MRI의 한 촬영 모드(T2*-weighted time series)이지, 별개 장비가 아니다.
구분 MRI (구조 영상) fMRI (기능 영상) 목적 정적 해부학적 구조 시간에 따른 뇌 활동 변화 측정 대상 조직별 수분 함량·물성 국소 혈류 내 산소화/탈산소화 헤모글로빈 비율 신호원(MR 성분) T1 이완 시간 (가중 영상) T2* 성분 (탈산소화 헤모글로빈에 민감) 대비(contrast) T1-weighted / T2-weighted BOLD (Blood Oxygen Level-Dependent) 측정 방식 1회 고해상도 촬영 EPI로 전뇌 반복 스캔 (≈ 2초/volume) 출력 3D 정적 이미지 4D 시계열 (3D 공간 × 시간) 공간 해상도 약1 mm 약 3 mm (SNR 확보 위해 낮춤) 시간 해상도 해당 없음(정적) 약 1–4 초 (HRF 지연이 상한) 가중치 선택 T1 선호 (회백질/백질 대비 우수) T2* 필수 (탈산소화 HB 민감) 분석 구조 시각화·용적 측정 조건 간 subtraction·correlation (GLM) 임상 활용 종양·병변·위축 진단 주로 연구용 (수술 전 언어/운동 국재화 일부)
왜 T2*인가? — 탈산소화 헤모글로빈(deoxyHb)은 상자성(paramagnetic) 이라 국소 자기장을 왜곡해 T2* 신호를 감쇠시킨다. 뉴런이 활성화되면 혈류가 산소 수요보다 과공급되어 deoxyHb 비율이 감소 → T2* 신호가 증가 → 이것이 BOLD 신호다. 따라서 fMRI는 신경 활동의 직접 측정이 아니라 혈역학적 간접 측정이라는 본질적 한계를 갖는다.
기억 포인트: “MRI는 물을 보고, fMRI는 산소를 본다. 같은 자석, 다른 가중치(weighting), 다른 시간축.”
MRI physics for non-physicists
Summary
MRI는 강한 자기장으로 수소 원자를 정렬시킨 후 라디오 주파수 펄스를 적용하여 영상을 생성한다. T1 이완 시간은 조직 구분에, *T2 성분**은 산소화되지 않은 헤모글로빈 감지에 사용되어 fMRI의 핵심 원리가 된다. EPI 기법으로 전뇌를 약 2초 만에 스캔할 수 있다.
MRI is used to create images of so tissue of the body, whi X-rays pass through largely undistorted. Most human tissue is water-based and the amount of water in ea type of tissue varies. Different types of tissue will thus behave in slightly different ways when stimulated, and this can be used to construct a three-dimensional image of the layout of these tissues (for an accessible, but more detailed description, see Savoy, 2002).
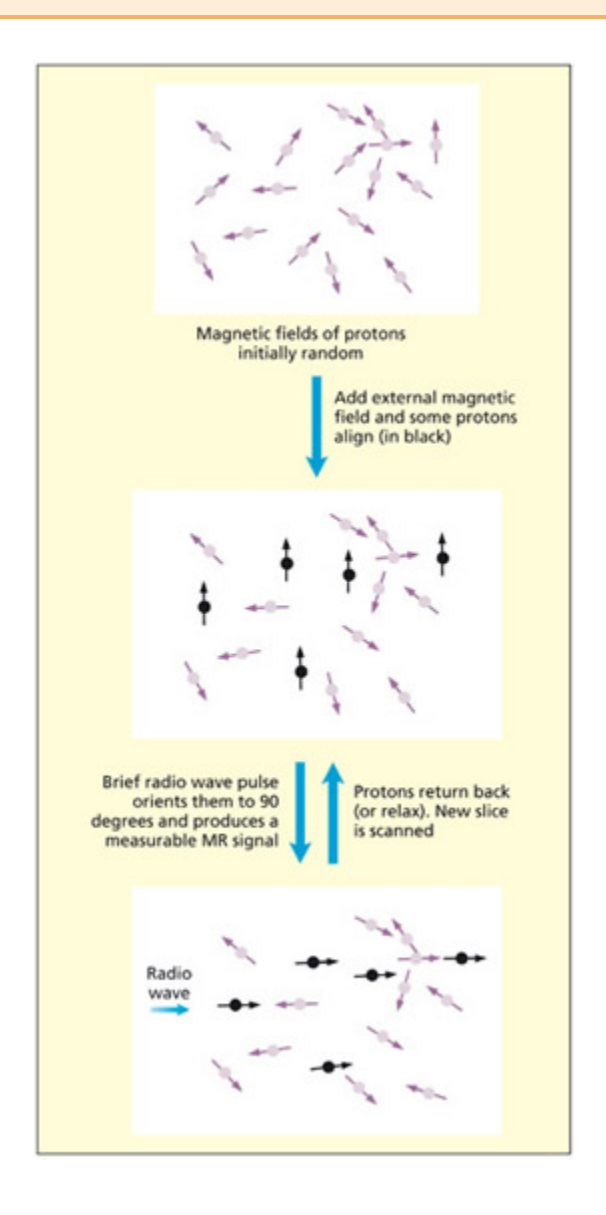
e sequence of events for acquiring an MRI scan is as follows. First, a strong magnetic field is applied across the part of the body being scanned (e.g. the brain). e single protons that are found in water molecules in the body (the hydrogen nuclei in H2O) have weak magnetic fields. (Other atoms and nuclei also have magnetic moments, but in MRI it is the hydrogen nuclei in water that form the source of the signal.) Initially, these fields will be oriented randomly, but when the strong external field is applied a small fraction of them will align themselves with this. e external field is applied constantly during the scanning process. e strength of the magnetic field is measured in units called tesla (T). Typical scanners have field strengths between 1.5 and 3 T; the Earth’s magnetic field is of the order of 0.0001 T.
When the protons are in the aligned state a brief radio frequency pulse is applied that knos the orientation of the aligned protons by 90 degrees to their original orientation. As the protons spin (or precess) in this new state, they produce a detectable ange in the magnetic field and this is what forms the basis of the MR signal. e protons will eventually be pulled ba into their original alignment with the magnetic field (they “relax”). e scanner repeats this process serially by sending the radio wave to excite different slices of the brain in turn. With the advent of acquisition methods su as eo planar imaging, a whole brain can typically be scanned in about 2 s with slices of around 3 mm.
Different types of image can be created from different components of the MR signal. Variations in the rate at whi the protons return ba to the aligned state following the radio frequency pulse (called the T1 relaxation time) can be used to distinguish between different types of tissue. ese T1 weighted images are typically used for structural images of the brain. In a T1-weighted image, gray maer looks gray and white maer looks white. When in the misaligned state, at 90 degrees to the magnetic field, the MR signal also decays because of local interactions with nearby molecules. is is termed the T2 component. Deoxyhemoglobin produces distortions in this component and this forms the basis of the image created in functional MRI experiments (called a T2* image, “tee-two-star”).
Why Are Mr Scanners So Noisy?
Summary
MR 스캐너의 소음은 전류가 코일을 통해 빠르게 켜고 꺼지면서 코일이 갑작스럽게 팽창하기 때문에 발생하며, 대부분 100 dB 이상의 소음을 낸다.
Very strong magnetic fields are created by passing electric currents through coils and switing them on and off rapidly. When the current is swited on it causes the coil to expand very slightly, but suddenly, and this generates a loud banging noise. Most MR scanners generate noise in excess of 100 dB.
📊 그림 설명
MRI 스캔 획득 과정의 순서를 단계별로 보여주는 다이어그램이다. 강한 외부 자기장이 수소 원자핵을 정렬시키고, 라디오 주파수 펄스가 정렬을 90도 회전시킨 후, 이완 과정에서 발생하는 MR 신호를 검출하는 과정을 나타낸다. 이 과정은 슬라이스별로 반복되며 EPI 기법을 사용하면 전뇌를 약 2초 만에 스캔할 수 있다.
MRI → fMRI: 구조 영상에서 기능 영상까지의 원리
1단계: MRI의 기본 원리 — 수소 원자로 구조를 본다
인체 조직은 대부분 물(H₂O)로 이루어져 있으며, 조직마다 수분 함량이 다르다. MRI는 이 차이를 이용해 영상을 만든다.
- 외부 자기장 적용 — 강한 자기장(1.5~3 T, 지구 자기장의 약 30,000배)을 걸면, 물 분자 속 수소 원자핵(양성자)의 약한 자기장이 외부 자기장 방향으로 정렬된다
- 라디오 주파수(RF) 펄스 — 짧은 RF 펄스를 쏘면, 정렬된 양성자들이 원래 방향에서 90도 회전한다
- 이완(Relaxation)과 신호 검출 — 양성자들이 회전된 상태에서 다시 원래 정렬로 돌아가면서(세차 운동, precession) 검출 가능한 자기장 변화를 만들어내고, 이것이 MR 신호가 된다
- 슬라이스별 반복 — 뇌의 각 단면(slice)에 순차적으로 RF 펄스를 보내 반복. 에코 평면 영상(EPI) 기법을 쓰면 전뇌를 약 2초 만에 스캔 가능
2단계: 서로 다른 영상 유형 — T1 vs T2*
양성자가 원래 정렬로 돌아가는 과정에서 두 가지 다른 신호를 추출할 수 있다:
영상 유형 측정하는 것 용도 T1 가중 영상 양성자가 원래 정렬로 복귀하는 속도(T1 이완 시간) — 조직마다 다름 구조적 영상: 회백질(회색)과 백질(흰색)을 구분 T2* 가중 영상 양성자가 90도 회전 상태에서 신호가 감쇠하는 속도 — 주변 분자의 영향을 받음 기능적 영상(fMRI): 탈산소화 헤모글로빈이 이 감쇠를 왜곡시키므로, 혈액 산소 농도 변화를 감지 2.5단계: 디옥시헤모글로빈은 어떻게 T2* 신호를 방해하는가?
T2* 신호의 핵심은 위상 일관성(phase coherence) 이다. RF 펄스로 90도 회전된 양성자들은 처음에는 모두 같은 타이밍(같은 위상)으로 세차 운동을 한다. 이 일관된 회전이 검출 가능한 MR 신호를 만들어낸다.
그런데 시간이 지나면 양성자들이 제각기 다른 속도로 돌기 시작한다(위상 이탈, dephasing). 신호가 서로 상쇄되면서 T2 신호가 감쇠한다. 여기에 국소 자기장 불균일성이 더해지면 감쇠가 더 빨라지는데, 이 추가 감쇠까지 포함한 것이 T2* 이다.
디옥시헤모글로빈이 바로 이 국소 자기장 불균일성의 원인이다:
[정상 상태]
균일한 자기장 → 양성자들이 같은 속도로 세차 → 위상 일관성 유지 → T2* 신호 강함

[디옥시헤모글로빈 존재]
디옥시Hb의 상자성 → 주변 자기장에 국소적 왜곡 생성
 → 인접한 양성자들이 서로 다른 세기의 자기장을 경험
 → 세차 속도가 제각각 → 위상 이탈 가속 → T2* 신호 빠르게 감쇠
상태 디옥시Hb 농도 자기장 균일성 위상 이탈 속도 T2* 신호 옥시헤모글로빈 (산소 결합) 낮음 균일 유지 느림 강함 (밝게) 디옥시헤모글로빈 (산소 방출) 높음 국소 왜곡 빠름 약함 (어둡게) 즉, 디옥시헤모글로빈은 상자성(paramagnetic) 물질이라 자기장을 끌어당겨 주변에 미세한 자기장 불균일을 만들고, 이것이 양성자들의 위상 일관성을 깨뜨려 T2* 신호를 더 빨리 감쇠시킨다. 옥시헤모글로빈은 반자성(diamagnetic) 이라 이런 왜곡을 거의 일으키지 않는다.
이 원리 덕분에 디옥시헤모글로빈 농도의 변화 = T2* 신호의 변화가 되고, 이것이 곧 BOLD 신호의 물리적 기반이 된다.
3단계: MRI → fMRI — BOLD 신호로 신경 활동을 “간접” 측정
fMRI의 핵심은 BOLD(Blood Oxygen Level-Dependent) 대비이다:
- 뉴런이 활동하면 → 산소를 소비하여 옥시헤모글로빈 → 디옥시헤모글로빈으로 전환
- 디옥시헤모글로빈은 강한 상자성(paramagnetic) 성질을 가져 주변 자기장을 왜곡 → T2* 신호를 변화시킴
- 산소 소비에 대한 보상 반응으로 해당 영역에 혈류가 증가 → 실제 소비보다 더 많은 산소가 공급됨(과잉 보상)
- 이 과잉 보상으로 디옥시헤모글로빈 농도가 오히려 감소 → BOLD 신호 증가 (이것이 fMRI에서 실제로 측정하는 것)
핵심 정리
MRI의 T2* 성분이 디옥시헤모글로빈에 민감하다는 물리적 성질 → 신경 활동 시 혈류 과잉 보상으로 디옥시헤모글로빈 농도가 변한다는 생리적 현상 → 이 둘을 결합한 것이 fMRI이다.
주의: fMRI는 뉴런의 전기적 활동을 직접 측정하는 것이 아니다. 신경 활동의 간접적 결과(downstream consequence)인 혈류 변화를 측정하며, 실제 신경 활동보다 수 초 지연된다. 이것이 fMRI의 시간 해상도(1~4초)가 EEG(밀리초)보다 낮은 근본적 이유이다.
e sequence of events in the acquisition of an MRI scan.
Functional Imaging
Summary
구조적 영상이 뇌의 영구적 해부학적 특성을 측정하는 반면, 기능적 영상은 인지 처리 변화와 관련된 순간적 뇌 활성화를 탐구한다. fMRI는 혈류 변화를 기반으로 동적 신경 활성화 패턴을 분석한다.
Whereas structural imaging measures the permanent aracteristics of the brain, functional imaging is designed to measure the moment-to-moment variable aracteristics of the brain that may be associated with anges in cognitive processing.
Basic physiology underpinning functional imaging
Summary
뇌는 신체 산소의 20%를 소비하며, 뉴런의 대사 활동 증가 시 해당 영역의 혈류량이 증가한다. VBM은 회백질/백질 밀도를 voxel 단위로 분석하고, DTI는 분수 이방성(FA)으로 백질 연결성을 측정한다. Bengtsson et al.(2005)은 피아노 학습이 학습 시기에 따라 다른 백질 섬유를 변화시킨다고 보고했다.
e brain consumes 20 percent of the body’s oxygen uptake; it does not store oxygen and it stores lile glucose. Most of the brain’s oxygen and energy needs are supplied from the local blood supply. When the metabolic activity of neurons increases, the blood supply to that region increases to meet the demand (for a review, see Raile, 1987; but see Awell & Iadecola, 2002). Te niques su as PET measure the ange in blood flow to a region directly, whereas fMRI is sensi tive to the concentration of oxygen in the blood. ey are therefore referred to as hemo dynamic methods.
| LinkingStructuretoFunctionbyImagingWhiteMatterandGrayMatter | |
|---|---|
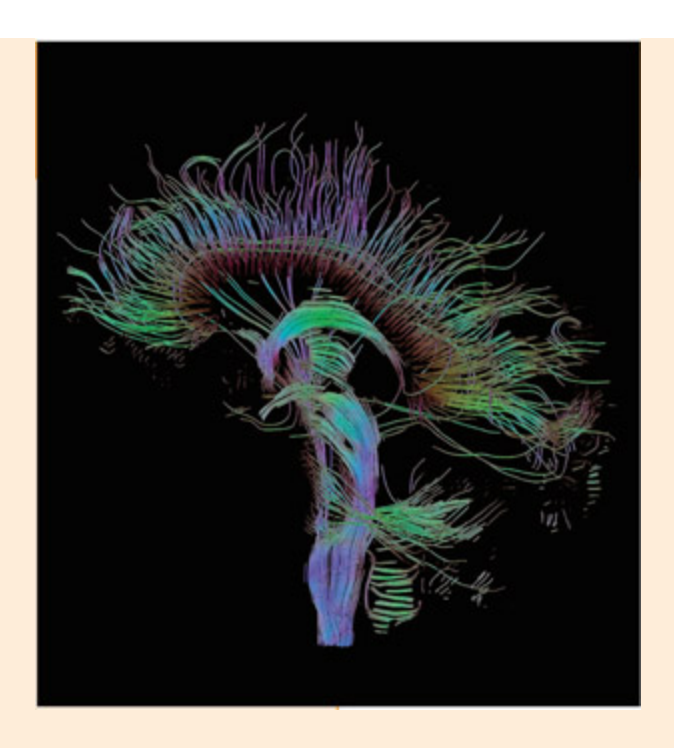
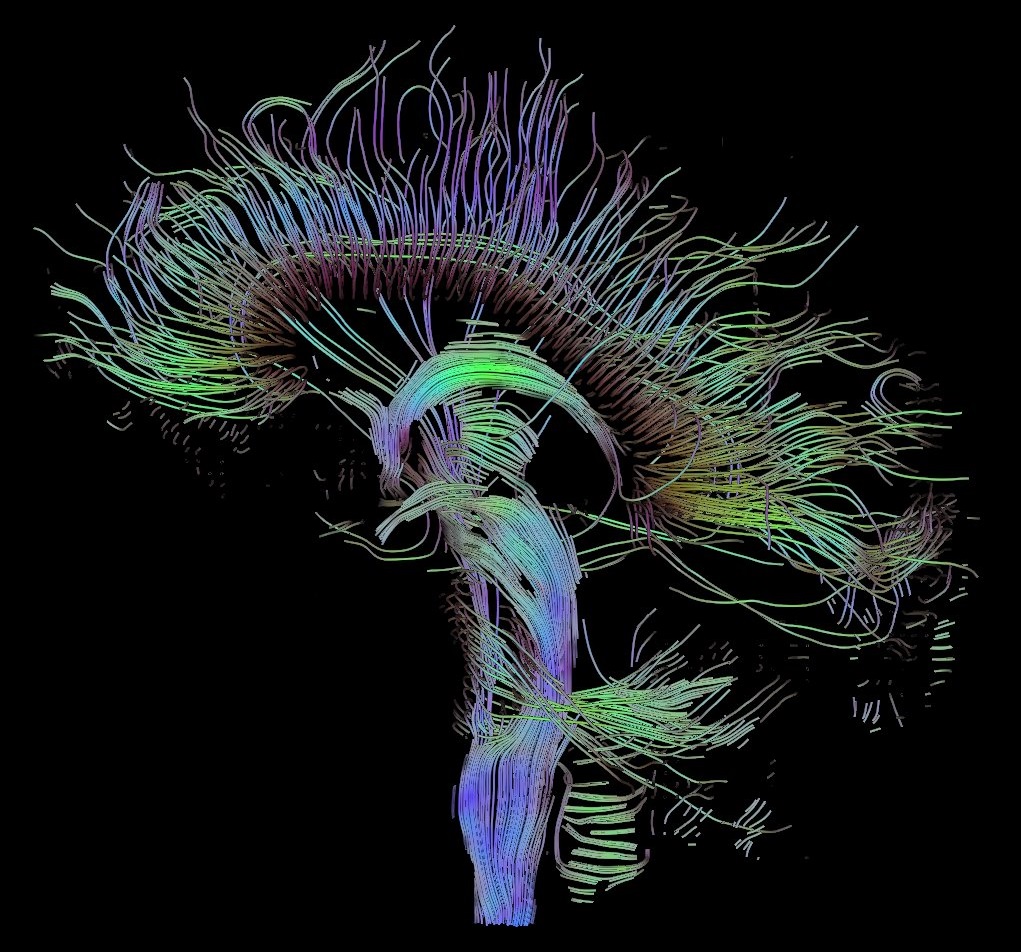
📊 그림 설명
확산 텐서 영상(DTI)으로 측정한 인간 뇌의 백질 섬유 경로를 시각화한 이미지이다. 정중시상면을 통과하는 재구성된 섬유 경로가 묘사되어 있으며, 각 섬유의 방향과 연결성을 색상으로 구분하여 나타낸다. DTI는 축삭 내 물질의 확산 방향성을 측정하여 뇌 영역 간 백질 연결성을 분석하는 데 활용된다.
Visualization of a DTI measurement of a human brain. Depicted are reconstructed fiber tracts that run through the mid-sagial plane.
Image by omas Sultz from hp://upload.wikimedia.org/wikipedia/commons/8/82/DTIsagial-fibers.jpg.
Small scale differences (at the millimeter level) in the organization and concentration of white maer and gray maer can now be analyzed noninvasively using MRI. is is providing important clues about how individual differences in brain structure are linked to individual differences in cognition. Two important methods are voxel-based morphometry, or VBM, and diffusion tensor imaging, or DTI.
Voxel-based morphometry (VBM) capitalizes on the ability of structural MRI to detect differences between gray maer and white maer (Ashburner & Friston, 2000). VBM divides the brain into tens of thousands of small regions, several cubic millimeters in size (called voxels) and the concentration of white/gray maer in ea voxel is estimated. It is then possible to use this measure to compare across individuals by asking questions su as these: If a new skill is learned, su as a second language, will gray maer density increase in some
brain regions? Will it decrease in other regions? How does a particular genetic variant affect brain development? Whi brain regions are larger, or smaller, in people with good social skills versus those who are less socially competent? Kanai and Rees (2011) provide a review of this method in relation to cognitive differences.
Diffusion tensor imaging (DTI) is different from VBM in that it measures the white maer connectivity between regions (Le Bihan et al., 2001). (Note: VBM measures the amount of white maer without any consideration of how it is connected.) It is able to do this because water molecules trapped in axons tend to diffuse in some directions but not others. Specifically, a water molecule is free to travel down the length of the axon but is prevented from traveling out of the axon by the fay membrane. When many su axons are arranged together it is possible to quantify this effect with MRI (using a measure called fractional anisotropy). As an example of a cognitive study using DTI, Bengtsson et al. (2005) found that learning to play the piano affects the development of certain white maer fibers. However, different fibers were implicated depending on whether the piano was learned during ildhood, adolescence, or adulthood.
Key Terms
Voxel-based morphometry (VBM)
A tenique for segregating and measuring differences in white maer and gray maer concentration.
VBM은 회백질과 백질의 농도 차이를 voxel 단위로 분리, 측정하는 뇌 구조 분석 방법으로, MRI 데이터를 기반으로 조직의 미세한 밀도 변화를 정량적으로 평가한다.
Diffusion tensor imaging (DTI)
Uses MRI to measure white maer connectivity between brain regions.
DTI는 MRI 기반으로 뇌 내 백질 연결성을 측정하며, 확산 텐서를 통해 백질의 미세 구조와 신경 회로의 방향성 정보를 제공한다.
Fractional anisotropy (FA)
A measure of the extent to whi diffusion takes place in some directions more than others.
분수 이방성(FA)은 확산의 방향 편향 정도를 측정하는 지표이다. 기능적 영상에서 뇌 영역이 “활성화”되었다는 것은 기준 조건 대비 생리적 반응이 더 크다는 의미이며, 혈류 측정법은 EEG/MEG와 달리 신경 활동의 간접적 다운스트림 결과를 반영한다.
e brain is always physiologically active. Neurons would die if they were starved of oxygen for more than a few minutes. is has important consequences for using physiological markers as the basis of neural “activity” in functional imaging experiments. It would be meaningless to place someone in a scanner, with a view to understanding cognition, and simply observe whi regions were receiving blood and using oxygen because this is a basic requirement of all neurons, all of the time. As su, when functional imaging researers refer to a region being “active,” what they mean is that the physiological response in one task is greater relative to some other condition. ere is a basic requirement in all functional imaging studies that the physiological response must be compared with one or more baseline responses. Good experimental practice is needed to ensure that the baseline task is appropriately mated to the experimental task otherwise the results will be very hard to interpret.
It is also worth pointing out that hemodynamic methods are not measuring the activity of neurons directly but, rather, are measuring a downstream consequence of neural activity (i.e. anges in blood flow/oxygen to meet metabolic needs). is is to be contrasted with methods su as EEG (electroencephalography) and MEG (magnetoencephalography) that measure the electrical/ magnetic fields generated by the activity of neurons themselves.
Positron emission tomography
Summary
PET은 방사성 추적제를 혈류에 주입하여 혈류량에 따른 방사선 신호를 측정한다. 공간 해상도는 약 10mm, 시간 해상도는 30초로 fMRI보다 낮지만, 방사성 신경전달물질을 활용한 특정 신경 경로 추적에 유리하다.
Positron emission tomography (PET) has been replaced by fMRI as the imaging method of oice. However, PET does still have a few advantages: radiolabelled pharmacological agents can be used to trace certain specific pathways, and it is less susceptible to signal distortion around the air cavities (e.g. sinuses, oral cavity) than fMRI. It is introduced briefly here, as many of the classic studies in functional imaging were based on this method.
PET uses a radioactive tracer injected into the bloodstream. e greater the blood flow in a region, the greater the signal emied by the tracer in that region. e most commonly used tracers are oxygen-15, administered in the form of water, and fluorine-18, administered in the form of a glucose sugar. However, it is also possible to use other tracers. For example, it is possible to use radiolabeled neurotransmiers to investigate particular neural pathways and to study the effects of drugs on the brain. Volkow et al. (1997), for instance, were able to study how different aspects of cocaine abuse (e.g. euphoria, craving, restlessness) are implemented by different systems in the brain by administering a radiolabeled tracer with a similar profile to the drug.
When the tracer is in the bloodstream it converts ba from the unstable radioactive form into the normal stable form. As it does so, it emits a particle (called a positron) that then collides with an electron, releasing two photons that can be detected by detectors positioned around the head, thus enabling a spatial image to be constructed. e positron travels 2–3 mm before collision. However, the need to average across participants in PET means that the effective spatial resolution is somewhat worse than this (about 10 mm). e spatial resolution refers to the accuracy with whi one can measure where a cognitive event (or more accurately, a physiological ange) is occurring.
In PET it takes 30 sec for the tracer to enter the brain and a further 30 sec for the radiation to peak to its maximum. is is the critical window for obtaining anges in blood flow related to cognitive activity. e temporal resolution of PET is therefore around 30 sec. e temporal resolution refers to the accuracy with whi one can measure when a cognitive event is
occurring. Given that most cognitive events take place within a second, this is very slow indeed.
Functional magnetic resonance imaging
Summary
fMRI는 방사선 없이 기존 MRI 장비를 사용하며, 시간 해상도 1~4초와 공간 해상도 1mm로 PET보다 우수하다. 참가자를 반복 스캔할 수 있고 1시간 이내에 검사가 완료되어, 최근 10년간 기능적 영상 실험에서 PET을 대체했다.
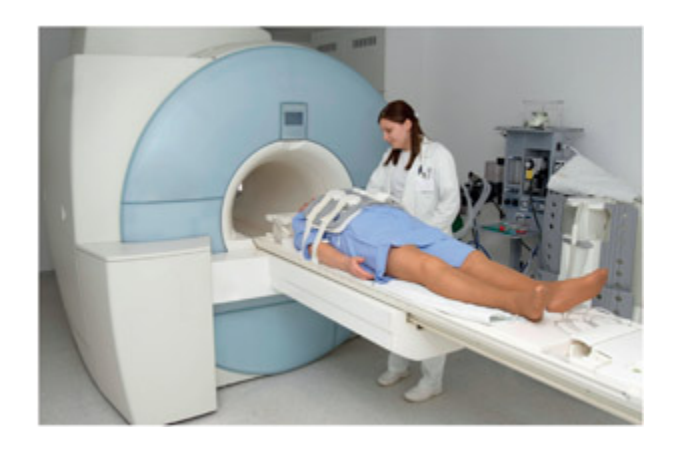
Functional magnetic resonance imaging (fMRI) uses standard MRI equipment and, unlike PET, there is no need for ionizing radiation. As su, it means that participants can be retested in the scanner many times, if need be. Testing of a single participant can normally be completed in under an hour, allowing 30–40 min to complete the experiment and 10 min for a highresolution structural MRI scan to be obtained.
📊 그림 설명
fMRI와 PET의 주요 특성을 비교하는 도표이다. fMRI는 방사선을 사용하지 않아 반복 스캔이 가능하고, 시간 해상도(1~4초)와 공간 해상도(1mm)가 PET(30초, 10mm)보다 우수하다. 지난 10년간 fMRI가 PET을 대체하여 기능적 영상 실험의 주요 도구가 된 이유를 시각적으로 보여준다.
Over the last 10 years functional magnetic resonance imaging (fMRI) has overtaken PET scans in functional imaging experiments.
시험 팁
PET vs fMRI 비교표를 외울 때 “PET은 느리고 크고 한 번, fMRI는 빠르고 작고 여러 번”으로 기억하자. PET: 시간 해상도 30초, 공간 해상도 10mm, 방사선 사용으로 1회 스캔. fMRI: 시간 해상도 1~4초, 공간 해상도 1mm, 방사선 없이 반복 스캔 가능. 단, PET만의 고유 장점은 방사성 신경전달물질 추적과 부비동 근처 영상화가 가능하다는 점이다.
| on radioactive tracer) • Participants scanned only once • Temporal resolution = 30 sec | deoxyhemoglobin levels) Participants scanned many times Temporal resolution = 1-4 sec |
|---|---|
| Effective spatial resolution = 10 mm Must use a blocked design | Spatial resolution = 1 mm Can use either blocked or event- |
| Sensitive to the whole brain | Some brain regions (e.g. near sinuses) are hard to image |
| Can use pharmacological tracers |
Key Terms
BOLD
Blood oxygen level-dependent contrast; the signal measured in fMRI that relates to the concentration of deoxyhemoglobin in the blood.
BOLD 대비는 fMRI에서 측정되는 신호로, 혈액 내 산소화되지 않은 헤모글로빈(deoxyhemoglobin) 농도 변화에 따라 발생하며, 신경 활동에 따른 혈류 변화를 간접적으로 반영한다.
Hemodynamic response function (HRF)
Changes in the BOLD signal over time.
HRF(혈역학적 반응 함수)는 BOLD 신호의 3단계 변화를 나타낸다: 초기 감소(산소 소비 증가), 과잉 보상(혈류 증가가 소비를 초과), 저하(기준선 복귀 전 일시 감소). BOLD 신호 변화량은 약 1~3%이며, fMRI의 시간 해상도는 수초 단위로 혈역학적 반응의 느린 특성에 제약을 받는다.
e component of the MR signal that is used in fMRI is sensitive to the amount of deoxyhemoglobin in the blood. When neurons consume oxygen they convert oxyhemoglobin to deoxyhemoglobin. Deoxyhemoglobin has strong paramagnetic properties and this introduces distortions in the local
magnetic field. is distortion can itself be measured to give an indication of the concentration of deoxyhemoglobin present in the blood. is tenique has therefore been termed BOLD (for blood oxygen-level-dependent contrast; Ogawa et al., 1990). e way that the BOLD signal evolves over time in response to an increase in neural activity is called the hemodynamic response function (HRF). e HRF has three phases, as ploed and discussed below (see also Hoge & Pike, 2001):
-
- Initial dip. As neurons consume oxygen there is a small rise in the amount of deoxyhemoglobin, whi results in a reduction of the BOLD signal (this is not always observed in 1.5 T magnets).
-
- Overcompensation. In response to the increased consumption of oxygen, the blood flow to the region increases. e increase in blood flow is greater than the increased consumption, whi means that the BOLD signal increases significantly. is is the component that is normally measured in fMRI.
-
- Undershoot. Finally, the blood flow and oxygen consumption dip before returning to their original levels. is may reflect a relaxation of the venous system, causing a temporary increase in deoxyhemoglobin again.
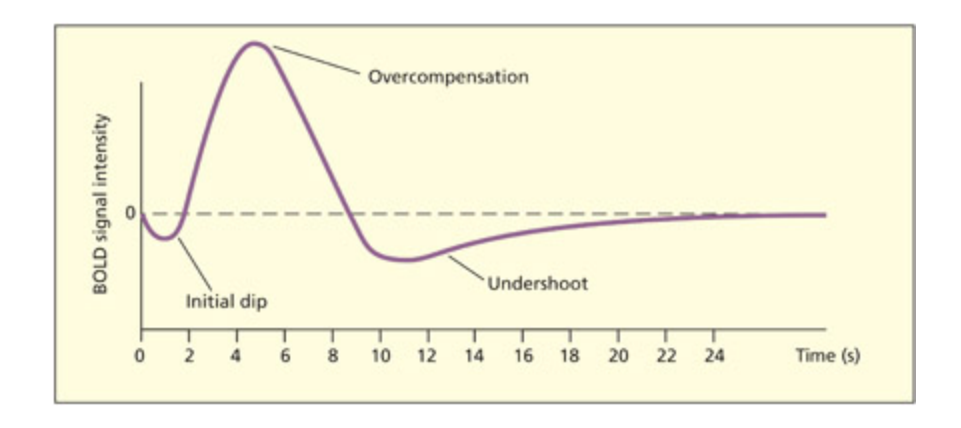
📊 그림 설명
혈역학적 반응 함수(HRF)의 시간에 따른 BOLD 신호 변화를 보여주는 그래프이다. 신경 활동 후 초기 감소(산소 소비 증가), 과잉 보상(혈류 증가가 소비를 초과), 부족 회복(기준선 복귀 전 일시적 감소)의 3단계가 명확히 구분되어 있다. 이 HRF의 과잉 보상 단계가 fMRI에서 일반적으로 측정되는 BOLD 신호의 핵심 성분이다.
e hemodynamic response function (HRF) has a number of distinct phases.
e hemodynamic signal anges are small—approximately 1–3 percent with moderately sized magnets (1.5 T). e hemodynamic response function
is relatively stable across sessions with the same participant in the same region, but is more variable across different regions within the same individual and more variable between individuals (Aguirre et al., 1998).
주의
BOLD 신호는 신경 활동 그 자체가 아니라 혈류 변화의 간접적 지표(downstream consequence)이다. 학생들이 자주 범하는 오류는 “fMRI가 뉴런 활동을 직접 측정한다”고 서술하는 것이다. HRF의 과잉 보상(overcompensation) 단계에서 측정되는 BOLD 신호는 실제 신경 활동보다 수초 지연되며, 이 시간 지연이 fMRI의 시간 해상도 한계의 근본 원인이다.
📊 그림 설명
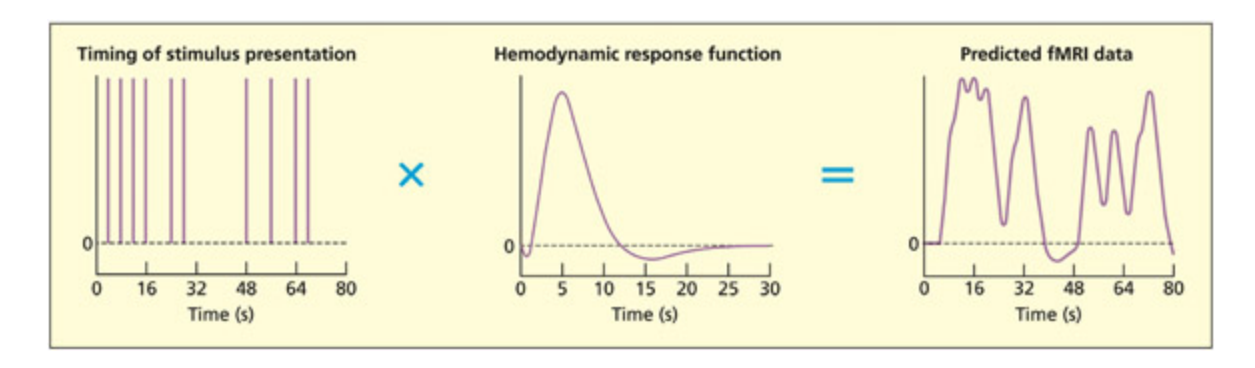
자극이 시간적으로 가깝게 제시될 때 개별 HRF가 서로 중첩되는 양상을 보여주는 그래프이다. 자극 간격이 충분히 길면(예: 16초) 단일 HRF 형태가 유지되지만, 빠르게 제시될 경우 여러 HRF가 합산되어 복합적인 BOLD 반응 패턴이 형성되며, 통계 분석은 이러한 예측된 패턴과 실제 voxel 신호 간의 일치도를 평가한다.
Unless the stimuli are presented far apart in time (e.g. every 16 sec) the predicted ange in BOLD response will not resemble a single HRF but will resemble many superimposed HRFs. Statistically, the analysis is trying to find out whi voxels in the brain show the predicted anges in the BOLD response over time, given the known design of the experiment and the estimated shape of the HRF. To aieve this there has to be sufficient variability in the predicted BOLD response (big peaks and troughs).
e spatial resolution of fMRI is around 1 mm depending on the size of the voxel. e temporal resolution of fMRI is several seconds and related to the rather sluggish hemodynamic response. is allows the use of eventrelated designs (see later), but it is still slow compared with the speed at whi cognitive processes take place. In fMRI the sluggishness of the hemodynamic response to peak and then return to baseline does place some constraints on the way that stimuli are presented in the scanning environment that differ from equivalent tasks done outside the scanner. However, it is not the case that one has to wait for the BOLD response to return to baseline before presenting another trial, as different HRFs can be superimposed on ea other (Dale & Buner, 1997). In general during fMRI, there may be fewer trials that are more spaced out in time than standard cognitive testing, and it is common to have “null events” (e.g. a blank screen). ese null events allow the BOLD signal to dip toward baseline, essentially providing the necessary variability in the signal needed for the
analysis. In standard cognitive psyology experiments (e.g. using response time measures) the amount of data is effectively the same as the number of trials and responses. In the equivalent fMRI experiment, the amount of data is related to the number of brain volumes acquired rather than the number of trials or responses.
Key Terms
Cognitive subtraction
A type of experimental design in functional imaging in whi activity in a control task is subtracted from activity in an experimental task.
인지 차감은 실험 조건의 뇌 활성화에서 제어 조건의 활성화를 빼는 방식으로, 특정 인지 과정에 해당하는 뇌 영역을 식별하는 실험 설계 전략이다.
From Image to Cognitive Theory: Experimental Design
Summary
이 섹션에서는 기능적 영상(functional imaging)을 통해 인지 이론(cognitive theory)과 연관된 뇌 활성화 영역을 탐구하는 실험 설계 방법론을 중심으로 설명하며, 특히 인지 차감(cognitive subtraction) 기법의 적용 사례를 다룬다. Petersen et al.(1988)의 연구를 예로 들어, 문자 인식, 구두 발음, 의미 추출과 같은 인지 과정에 해당하는 뇌 영역을 파악하기 위해 실험 조건(예: 단어 읽기)과 제어 조건(예: 교차 기호 관찰) 간의 활성화 차이를 비교하는 방식을 제시한다. 문자 인식은 양측 시각피질과 좌측 후두-전두 접합부에서 활성화가 관찰되었으며, 구두 발음은 양측 감각운동피질, 의미 추출은 좌측 하부 전두 회구와 관련된 것으로 나타났다. 특히 의미 추출과 관련된 활성화는 피질 손상 데이터(lesion data)와의 불일치로 인해 논란을 일으켰다. 이 연구는 인지 차감 기법이 특정 인지 성분만을 고립시키기 위해 두 개 이상의 조건 비교가 필수적임을 강조하며, fMRI(기능적 자기공명영상)를 기반으로 한 BOLD 대비(Blood Oxygen Level-Dependent contrast) 신호를 통해 혈관 생성 반응(hemodynamic response)을 분석한 결과를 보여준다. 이는 이전 섹션에서 논의된 기능적 영상의 동적 신경 활성화 패턴 분석과 연결되는 핵심 사례로, 인지 과정의 생리학적 기초를 탐구하는 데 기여한다.
An example of cognitive subtraction methodology
Summary
이 섹션에서는 인지 차감(Cognitive subtraction) 방법론의 예시로, **Petersen et al. (1988)**의 연구를 중심으로 설명한다. 이 연구는 기능적 영상(functional imaging)을 통해 문자와 구어 단어 처리에 특화된 뇌 영역을 탐구하는 데 초점을 맞추었으며, 인지 차감은 특정 인지 과정(예: 시각적 어휘 인식)에 해당하는 뇌 활성화 영역을 식별하기 위해 실험 조건과 제어 조건 간의 활성화 차이를 비교하는 기법이다. 연구에서는 문자 인식(written word recognition)을 분석하기 위해 단순한 단어 시선(passive viewing of words)과 십자 기호 시선(passive viewing of a cross)을 비교했으며, 구어 출력(spoken output) 관련 영역을 탐구하기 위해 단어 시선(passive viewing of words)과 단어 읽기(reading aloud)를 비교했다. 또한 의미 추출(semantic retrieval)을 분석하기 위해 동사 생성(verb generation)과 단어 읽기를 비교하여, 좌측 하부 전두엽(left inferior frontal gyrus)이 활성화되는 결과를 보였다. 다만, 이 결과는 뇌 손상 데이터(lesion data)와의 차이로 인해 논란을 낳았으며, 그 이유는 후속 섹션에서 논의된다. 이 연구는 인지 차감이 시각 처리(visual processing), 단어 인식(word recognition), 구어 생성(spoken production)과 같은 기본 인지 단계(basic cognitive stages)를 분리해 분석할 수 있음을 보여주며, 좌측 측두엽-후두엽 접합부(left occipitotemporal junction)와 시각 피질(visual cortex) 등이 문자 인식에 관여함을 밝혀냈다.
One of the groundbreaking studies for establishing the use of functional imaging of cognition was that by Petersen et al. (1988), whi was designed to look for brain regions specialized for the processing of wrien and spoken words. A consideration of this study provides a good introduction to the principle of cognitive subtraction. e idea behind cognitive subtraction is that, by comparing the activity of the brain in a task that utilizes a particular cognitive component (e.g. the visual lexicon) to the activity of the brain in a baseline task that does not, it is possible to infer whi regions are specialized for this particular cognitive component. As has been noted, the
brain is always active in the physiological sense and so it is not possible to infer from a single task whi regions are dedicated to specific aspects of the task; a comparison between two or more tasks or conditions is always needed.
Let’s consider the different processes involved with reading and understanding isolated wrien words. A simple model of wrien word recognition is given below, whi forms the motivation for the imaging study to be described. e study by Petersen et al. (1988) was concerned with identifying brain regions involved with: (1) recognizing wrien words; (2) saying the words; and (3) retrieving the meaning of the words. To do this, the researers performed a number of cognitive subtractions.
To work out whi regions are involved with recognizing wrien words, Petersen et al. compared brain activity when passively viewing words (e.g. CAKE) with passively viewing a cross (+) (see diagram on the next page). e logic is that both experimental and baseline tasks involve visual processing (and so a subtraction should cancel this out), but only the experimental task involves visual word recognition (so this should remain aer subtraction).
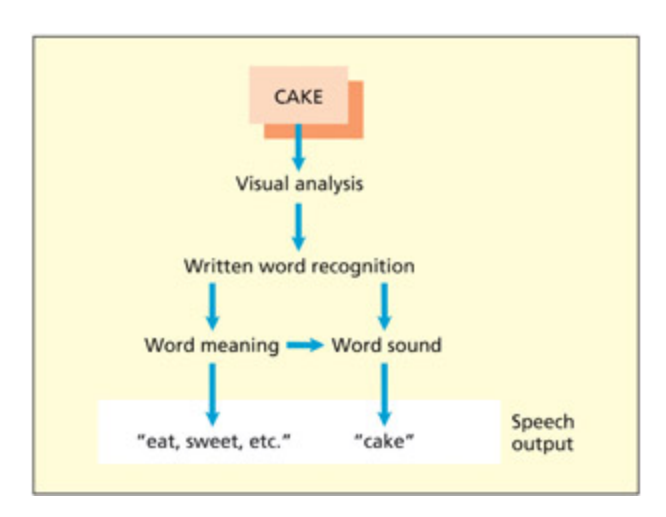
Basic cognitive stages involved in reading wrien words aloud and producing spoken semantic associates to wrien words.
📊 그림 설명
문자 단어를 소리 내어 읽고 의미적 연상어를 산출하는 과정의 기본 인지 단계를 도식화한 그림이다. 시각 처리에서 시작하여 단어 인식(시각 어휘), 음운 출력(발화), 의미 추출(세마틱 시스템) 단계로 이어지며, 각 단계를 분리하기 위해 인지 차감 실험이 설계된 논리적 근거를 보여준다.
To work out whi regions are involved with producing spoken words they compared passive viewing of wrien words (see CAKE) with reading aloud the word (see CAKE, say “cake”). In this instance, both experimental and baseline tasks involve visual processing of the word and word recognition (so subtracting should cancel these out), but only the experimental task involves spoken output (so activity associated with this should remain aer subtraction).
To work out whi regions are involved with retrieving the meaning of wrien words, they compared a verb-generation task (e.g. see CAKE, say “eat”) with reading aloud (e.g. see CAKE, say “cake”). In this instance, both experimental and baseline tasks involve visual processing, word recognition and spoken output (so subtracting should cancel out the activity associated with these processes), but only the experimental task involves generating a semantic associate (so activity associated with this should remain aer subtraction).
e results of these subtractions show activity in a number of different sites. Only the principal sites on the le lateral hemisphere are depicted in the diagram. Recognizing wrien words activates bilateral sites in the visual (striate) cortex as well as a site on the le occipitotemporal junction. Producing spee output in the reading aloud condition activates the sensorimotor cortex bilaterally, whereas verb generation activates the le inferior frontal gyrus. is last result has provoked some controversy because of an apparent discrepancy from lesion data; this is discussed later.
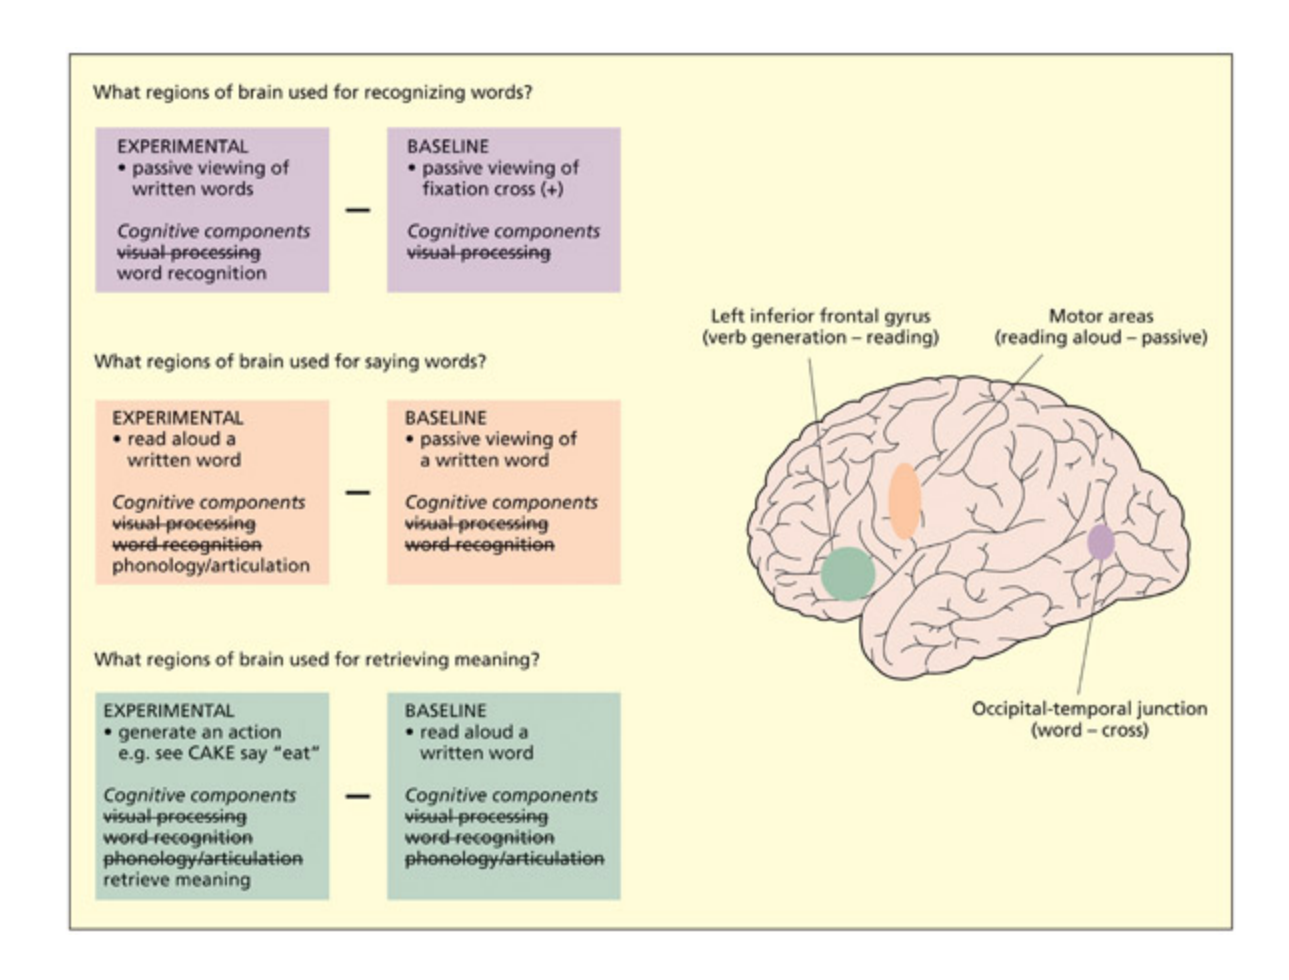
Cognitive subtraction is founded on the assumption that it is possible to find two tasks (an experimental and baseline task) that differ in terms of a small number of cognitive components. e results show several regions of activity, but only the main results on the le lateral surface are depicted here.
📊 그림 설명
Petersen et al.(1988)의 인지 차감 실험 결과를 좌측 대뇌 반구 표면에 표시한 그림이다. 문자 인식(시각 피질 및 좌측 후두-측두 접합부), 발화 출력(양측 감각운동피질), 동사 생성(좌측 하전두회) 등 각 인지 차감 단계에서 확인된 주요 활성화 영역이 표시되어 있으며, 실험 조건과 기준 조건 간의 차이로 도출된 결과이다.
Problems with cognitive subtraction
Summary
이 섹션에서는 인지 차감(Cognitive subtraction) 기법의 핵심 가정인 “pure insertion”(순수 삽입) 및 “pure deletion”(순수 삭제) 개념의 한계를 지적한다. 이 가정은 특정 인지 과정에 해당하는 작업에 새로운 구성 요소를 추가하거나 기존 구성 요소를 제거할 때, 나머지 구성 요소의 작동 방식이 변화하지 않는다는 것을 전제로 한다. 그러나 이는 실제 실험 환경에서는 성립되지 않으며, 추가/삭제된 구성 요소가 다른 요소들과 상호작용하거나 시스템 전체의 처리 방식을 재구성할 수 있는 경우가 많아, 차감 기법을 통해 도출된 뇌 활성화 영역의 해석에 오류가 발생할 수 있다는 점을 강조한다. 특히, 인지 과정의 복잡한 상호작용을 단순한 수학적 차감으로 설명하려는 시도는 뇌 기능의 다층적 구조를 간과하게 되며, 이는 인지 이론과의 연관성을 탐구하는 실험 설계에 심각한 제약을 초래할 수 있다.
Key Terms
Pure insertion (also pure deletion)
e assumption that adding a different component to a task does not ange the operation of other components.
Interactions
e effect of one variable upon another.
이 섹션에서는 기능적 영상(functional imaging) 실험에서 인지 차감(cognitive subtraction) 기법의 한계와 변수 간 상호작용(interaction) 문제를 다룬다. 인지 차감은 실험 조건과 제어 조건 간의 뇌 활성화 차이를 비교하여 특정 인지 과정에 해당하는 영역을 식별하는 데 사용되나, 순수 삽입(pure insertion) 가정—that 추가된 인지 성분이 기존 성분에 영향을 주지 않는다는 가정—이 실질적으로 성립되지 않을 수 있는 문제가 있다.
With the benefit of hindsight, there are a number of difficulties with this study, some of whi are related to the particular oice of baseline tasks that were employed. However, there are also more general problems with the method of cognitive subtraction itself (Friston et al., 1996). Consider the subtraction aimed at identifying brain regions associated with wrien word recognition. e assumption here was that both tasks involve visual processing but that one has the added component of word recognition. at is, one assumes that adding an extra component does not affect the operation of earlier ones in the sequence. is is referred to as the assumption of pure insertion (or pure deletion). It could be that the type or amount of visual processing that deals with wrien words is not the same as for non-linguistic vision. e fact that the visual information presented in the baseline task (viewing a cross, +) was simpler than in the experimental task makes this a real possibility. However, a more basic problem is common to all functional imaging experiments that employ this methodology. e addition of an extra component in the task has the potential to ange the operation of other components in the task. at is, interactions are possible that make the imaging data, at best, ambiguous. e next sections consider other types of design that allow one to eliminate or even directly study these interactions.
e oice of baseline is crucial in imaging experiments and can have substantial impacts on the data that is obtained. Ideally, the baseline should be as similar to the experimental task as possible. For example, to find brain regions involved with producing spoken words, Petersen et al. (1988)
compared reading aloud with viewing of wrien words. is is likely to involve several stages of processing. It will involve retrieving the word from the brain’s store of vocabulary (the mental lexicon), preparing and executing a motor command (to speak) and also listening to what was said. e paern of activity observed is therefore ambiguous with regards to linking a precise cognitive function with brain structure. Another baseline that could be used is to get the participant to articulate generic verbal responses, su as saying the word “yes” whenever a word comes up (Price et al., 1996a). is would enable one to study the lexical retrieval component while factoring out the articulation and auditory feedba components.
In summary, functional imaging requires comparisons to be made between different conditions because the brain is always physiologically active. Regions of “activity” can only be meaningfully interpreted relative to a baseline, and the selection of an appropriate baseline requires a good cognitive theory of the elements that comprise the task. e simplest way of aieving this is the method of cognitive subtraction that compares activity in an experimental task with activity in a closely mated baseline task. However, the main problem with cognitive subtraction is that it assumes that a cognitive component can be added on to a task without anging the other components in the task (the problem of pure insertion). Adding a new component to a task may interact with existing components and this interaction may show up as a region of activity. Other types of experimental design that reduce this particular problem have been developed and are discussed in the next section.
주의
인지 차감(cognitive subtraction)의 “순수 삽입(pure insertion)” 가정은 시험에서 자주 출제되는 비판 포인트이다. 많은 학생이 인지 차감의 결과를 그대로 수용하지만, 실제로는 과제에 새로운 구성 요소를 추가하면 기존 구성 요소의 작동 방식이 변할 수 있다. 예: 단어를 “보기만 하는 것”과 “소리 내어 읽는 것”은 시각 처리 자체도 달라질 수 있으므로, 차감 결과가 순수하게 “발화” 영역만을 반영한다고 단정할 수 없다.
Cognitive conjunctions and factorial designs
Summary
이 섹션에서는 인지 결합(cognitive conjunction)과 요인 설계(factorial design)를 활용한 실험 설계 방법론을 제시하며, 기존 인지 차감(cognitive subtraction) 기법의 한계를 극복하기 위한 접근 방식을 탐구한다. 요인 설계는 실험 조건 간의 상호작용(interaction)을 명시적으로 고려함으로써, 단순한 조건 차이를 넘어 복합적인 인지 과정의 뇌 활성화 패턴을 분석할 수 있는 장점을 제공한다. 특히, 인지 결합은 두 개 이상의 인지 작업을 동시에 수행하는 조건을 설정하여, 특정 뇌 영역이 복합적 인지 과정에 어떻게 반응하는지를 탐색하는 데 초점을 맞춘다. 이는 기존 순수 삽입(pure insertion) 가정의 한계를 해결하고, 다변량 분석(multivariate analysis)을 통해 더 정교한 신경 기능 해석이 가능하도록 한다. 예를 들어, 요인 설계를 통해 주요 효과(main effect)와 상호작용 효과(interaction effect)를 동시에 평가함으로써, 단일 조건 비교보다 더 풍부한 인지-뇌 연관성을 도출할 수 있다는 점이 강조된다. 또한, 이 방법론은 실험적 제어(experimental control)를 강화하여, 인지 과정의 복잡한 구성 요소 간 관계를 정량적으로 해석하는 데 기여한다.
Key Terms
Efference copy
A motor signal used to predict sensory consequences of an action.
자기 생성 감각 자극(self-produced touch)이 외부 자극에 비해 덜 tingly(시린 느낌)인 현상을 efference copy(운동 명령의 복사본) 개념으로 해석한다. Blakemore et al.(1998)의 실험에서 자기 생성 자극 시 somatosensory cortex(체감피질)의 활성도가 감소하고, cerebellum(소뇌)의 활성도 변화가 efference copy와 직접 연결된 신경 기전으로 해석되었다.
e method of cognitive conjunction requires that one is able to identify a set of tasks that has a particular component in common. One can then look for regions of activation that are shared across several different subtractions rather than relying on a single subtraction. A baseline task (or tasks) is still required, but the problem of interactions can be reduced. is is because the interaction terms will be different for ea pair of subtractions.
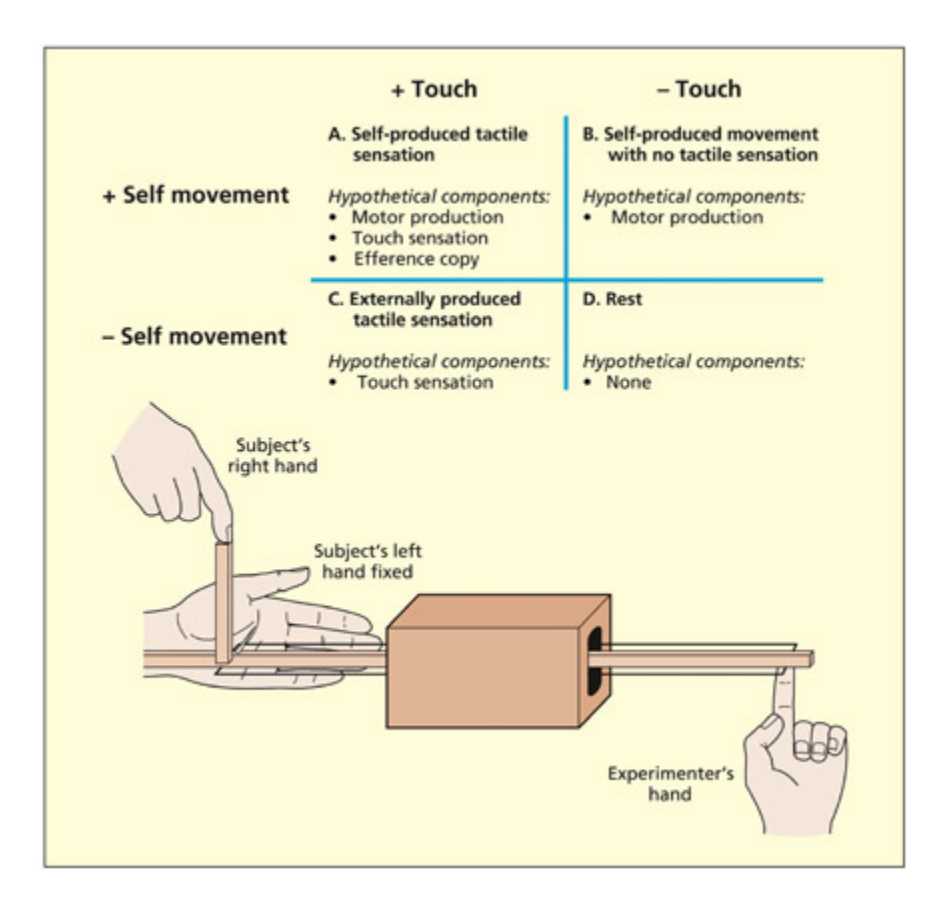
Why can’t we tile ourselves? Self-produced toues (condition A) are less tily because we can predict their sensory consequences using an “efference copy” of the motor command.
Boom diagram adapted from Blakemore et al., 1998. © 1998 Elsevier. Reproduced with permission.
📊 그림 설명
자기 생성 접촉(self-produced touch)이 외부 접촉보다 덜 간지러운 현상을 설명하는 요인 설계 실험 도표이다. 2개의 요인(촉각 자극 유무, 팔 움직임 유무)으로 4가지 조건(A~D)이 구성되며, 효과 복사(efference copy) 개념을 통해 자기 생성 자극의 감각 예측 메커니즘과 관련된 체감피질 및 소뇌의 활성화 변화를 보여준다.
Let’s consider one concrete example from the literature: why can’t we tile ourselves? Tactile sensations applied to the skin are rated as less tilish if produced by oneself relative to if they are elicited by another person. e key to explaining this lies in the fact that it is possible to predict the sensory consequences of our own actions. e motor commands that we generate specify where and when the tou will occur and the manner of the tou (e.g. a rough or gentle tile). is information can then be used to predict what the action will feel like. us a representation of the motor command (a so-called efference copy) is sent to the relevant sensory area, tou in this example, so that the perceptual system knows what to expect. is may help the brain to prioritize incoming sensory information toward the most relevant stimuli in the environment. Being toued by someone or something else is arguably more important to the organism in terms of detecting potential threats than being toued by oneself.
To investigate this, Blakemore et al. (1998) set up a factorial design with two factors. e first factor was whether a tactile stimulus was felt; the second factor was whether the participants moved their arm. e experiment involved moving a felt rod that tiled the palm. e rod could be moved either by the experimenter or the participant. It could either make contact with the palm or miss it altogether. In total, this produced four experimental conditions, whi have been labeled A to D in the figure.
Before going on to consider the neural basis of the less tily sensation associated with condition A (hypothetically due to an efference copy), one can perform two cognitive conjunctions to identify regions involved in motor production and the tactile sensation per se. Consider the two pairs of subtractions, A – B and C – D. If one asks the question, “What regions do these subtractions have in common [i.e. (A – B) and (C – D)]?”, then this can isolate regions involved in tactile sensation. e experiment found activity in the primary and secondary somatosensory cortex in the hemisphere opposite the hand that was stimulated. Consider the two pairs of subtractions, A – C and B – D. If one asks the question, “What regions do these subtractions have in common [i.e. (A – C) and (B – D)]?”, then this can isolate regions involved in motor production. In this analysis, the
experiment found several active regions, including primary motor, premotor and prefrontal regions. In terms of methodology, the key point to note is that both of these results are based on conjunctions between two different tasks and baselines and this is sufficient to minimize the problem of pure insertion faced by using a single subtraction alone.
However, these conjunction analyses do not enable one to analyze the neural basis of the efference copy or the reduced tilishness when selfproduced. To find this out, one can examine the interaction directly by performing the following analysis: (A – B) – (C – D). is effectively asks the question: is the difference between A and B more (or less) than the difference between C and D (an interaction is simply a difference of differences)? In the present example, it would ask whether the effect of tou is greater in the presence of self-movement than in the presence of othermovement. Blakemore et al. (1998) report that there was decreased activity in the somatosensory cortex. is is likely to be the neural correlate of reduced tilishness. ere were also anges in cerebellum activity that were not found in any other condition and were interpreted as the neural correlate of the efference copy that links self-movement with tou.
Blakemore et al. (1998) 실험 상세 분석
연구 질문: 왜 우리는 스스로를 간지럽힐 수 없는가? (Why can’t we tickle ourselves?)
핵심 가설: 자기 운동 명령(motor command)의 복사본인 efference copy가 감각영역으로 전달되어, 접촉이 일어나기 전에 감각 결과를 예측(predict)·상쇄(cancel)한다. 따라서 자기 생성 접촉은 타인 생성 접촉보다 덜 간지럽게 지각된다.
2×2 요인 설계 (Factorial Design)
- Factor 1 (촉각 자극): 팔에 접촉 있음 / 없음
- Factor 2 (운동 주체): 참가자 본인 움직임(self) / 실험자 움직임(other)
- 장치: 실험자 또는 참가자가 조종하는 막대(felt rod)가 참가자의 손바닥을 쓸거나(touch) 비껴간다(no touch)
조건 운동 주체 촉각 의미 A self touch ✓ 자기 생성 접촉 (간지럼 ↓ — 핵심 조건) B self touch ✗ 자기 운동만 (감각 없음) C other touch ✓ 타인 생성 접촉 (간지럼 ↑) D other touch ✗ 타인 운동만 (감각 없음)
세 가지 분석 전략
① Conjunction 1: (A−B) ∩ (C−D) → 촉각 감각(tactile sensation)
- (A−B): self-movement 하에서 touch vs no-touch
- (C−D): other-movement 하에서 touch vs no-touch
- 공통으로 살아남는 영역 = 운동 주체와 무관하게 “접촉 자체”에 반응하는 영역
- 결과: 대측 1차·2차 체감피질(primary & secondary somatosensory cortex, contralateral)
② Conjunction 2: (A−C) ∩ (B−D) → 운동 생성(motor production)
- (A−C): touch 조건에서 self vs other
- (B−D): no-touch 조건에서 self vs other
- 공통으로 살아남는 영역 = 촉각 유무와 무관하게 “자기 운동”에 반응하는 영역
- 결과: 1차 운동피질, premotor, prefrontal 영역
③ Interaction: (A−B) − (C−D) → efference copy의 신경 기저
- “차이의 차이(difference of differences)” — 촉각의 효과가 운동 주체에 따라 달라지는가?
- 즉, 자기 운동일 때의 촉각 반응이 타인 운동일 때보다 작은지(상쇄되는지) 검증
- 결과:
- 체감피질 활성 감소 → 간지럼 감소(reduced ticklishness)의 신경 상관물
- 소뇌(cerebellum)의 고유한 활성 변화 → 운동 명령과 감각 예측을 잇는 efference copy 자체의 신경 기저로 해석
방법론적 교훈
- Conjunction은 여러 subtraction을 가로질러 공통 영역을 찾으므로, pure insertion 가정 위반으로 인한 단일 subtraction의 해석 모호성을 완화한다.
- Interaction은 오히려 상호작용 그 자체를 연구 대상으로 삼는다 — cognitive subtraction이 “지워버리고 싶어 하는” 교호작용을 여기서는 핵심 발견으로 전환.
- 즉, factorial design은 (1) subtraction의 한계를 우회하면서도 (2) subtraction으로는 절대 드러나지 않는 인지 성분(여기서는 efference copy)을 직접 포착한다.
Parametric designs
Summary
이 섹션에서는 파라메트릭 디자인(parametric design)과 범주형 디자인(categorical design)의 차이점을 설명하며, 변수를 연속적인 차원(continuous dimension)으로 처리하는 방식을 강조한다. 예로 Price et al.(1992)의 연구에서 참가자들이 0~90 단어/분의 다양한 속도로 말하는 음성을 수동적으로 듣는 실험을 소개한다. 이 실험에서 뇌 활성화 변화를 속도 변화와 연관시키며, 기본 조건(baseline condition)을 별도로 설정하지 않고 모든 속도 수준에 걸쳐 전역적으로 효과를 평가한다. 청각 피질(primary auditory cortex)에서는 속도가 빨라질수록 활성화가 증가했으나, 언어 비음성 처리 영역(예: Wernicke’s area)에서는 속도와 관계없이 단어 존재에 따라 활성화가 발생했다. 언어 작업 기억(verbal working memory)에 관련된 좌측 전두엽 피질(left dorsolateral prefrontal cortex)에서는 속도 증가에 따라 활성화가 증가하다가 다시 감소하는 역상자형(inverted-U) 패턴이 관찰되어, 작업 기억의 한계된 용량(limited capacity)이라는 개념과 일치하는 결과를 보였다. 또한, 이 영역은 인지 차감(cognitive subtraction)이나 요인 설계(factorial design)를 사용해 20과 50 단어/분을 비교했을 경우, 작업에 관여하지 않는 것으로 나타났을 수 있다.
e main difference between a parametric design and a categorical design is that, in a parametric design, the variable of interest is treated as a continuous dimension rather than a categorical distinction (Friston, 1997). In intuitive terms, one is measuring associations between brain activity and anges in the variable of interest, rather than measuring differences in brain activity between two or more conditions. us, one is ultimately likely to use correlations (or similar) to analyze data collected using a parametric design.
Price et al. (1992) conducted an imaging study in whi participants listened passively to lists of spoken words spoken at six different rates between 0 words per minute (i.e. silence, or rest) and 90 words per minute.
e ange in activity in various regions could then be correlated with the rate of spee. Note that in a parametric design su as this, a separate baseline condition is not necessary (the effects are evaluated globally across all levels of the factor). In terms of the results, a number of interesting findings were observed. In areas involved in auditory perception (e.g. the primary auditory cortex), the faster the spee rate, the greater the activity. However, in regions involved in non-acoustic processing of language (e.g. Wernie’s area), the activity was related to the presence of words irrespective of spee rate. In a region oen associated with verbal working memory (the le dorsolateral prefrontal cortex), a more complex picture was found (Friston, 1997). Activity increased with spee rate but then decreased as the spee rate got faster (an inverted-U function). It suggests that the region has an optimal level at whi it functions, beyond whi it fails to keep up. is is consistent with the notion of working memory having a limited capacity. One interesting point to note is that, if the experimenters had compared 20 words per minute with 50 words per minute in a cognitive subtraction or a factorial design, this region would not have appeared to be implicated in the task.
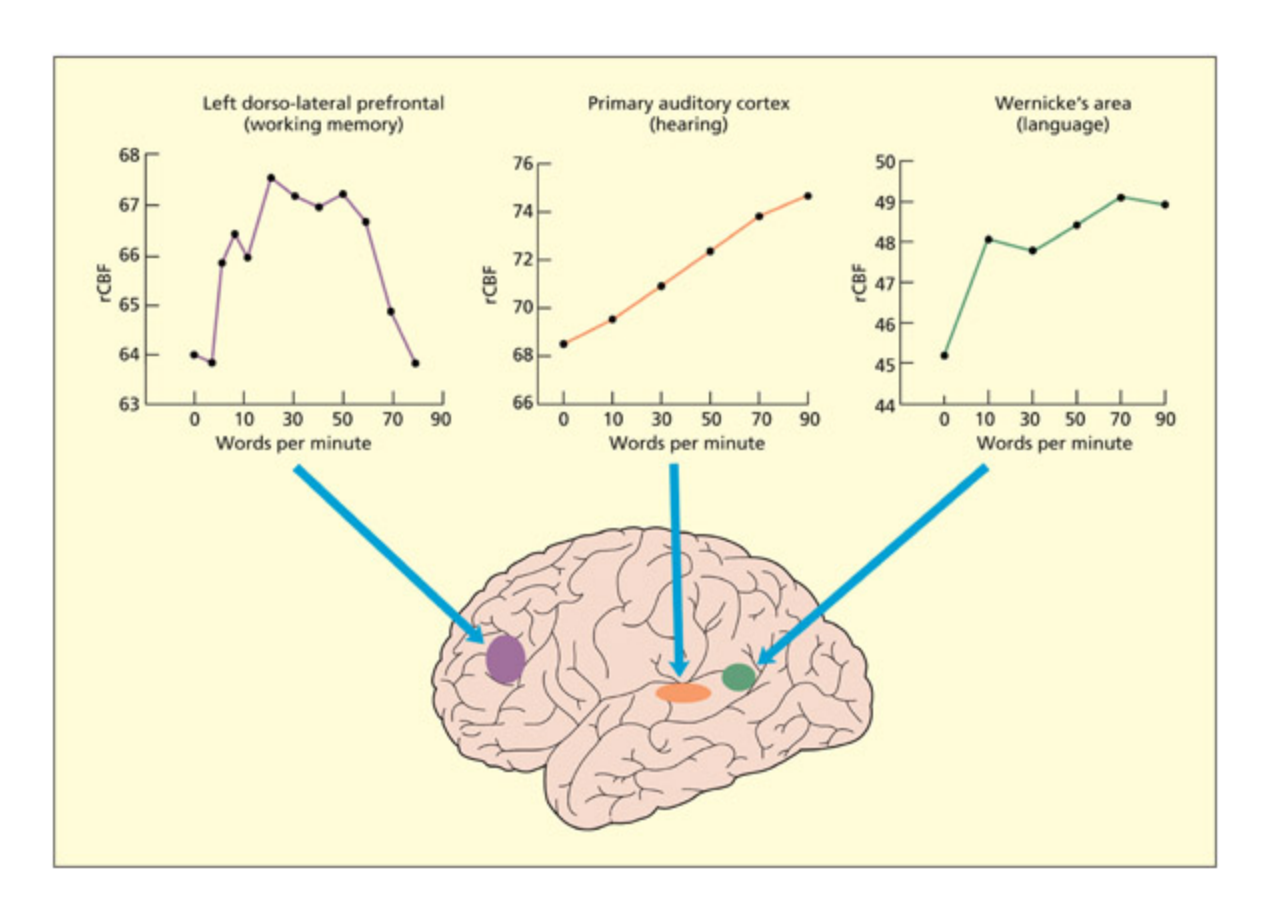
Different regions of the brain respond to anges in spee rate (words per minute, wpm) in different ways. Note that 0 wpm is equivalent to rest. rCBF = regional cerebral blood flow. Adapted from Price et al., 1992, and Friston, 1997.
📊 그림 설명
파라메트릭 설계를 사용한 Price et al.(1992) 연구에서 발화 속도(분당 단어 수)에 따른 뇌 영역별 혈류 변화(rCBF)를 나타낸 그래프이다. 일차 청각 피질은 속도에 비례하여 활성화가 증가하고, Wernicke 영역은 단어 존재 여부에만 반응하며, 좌측 배외측 전전두피질은 역U자형 패턴을 보여 작업 기억의 제한된 용량을 반영한다.
Functional integration
Summary
기능적 통합은 뇌 영역 간 상호작용과 커뮤니케이션을 분석하며, 구조적 방정식 모델링 등으로 효과적 연결성을 추정한다. 정신분열증 환자에서는 전두엽-측두엽 간 연결 실패가 관찰되었고, 휴식 상태 패러다임과 기본 모드 네트워크 분석을 통해 내재적 뇌 네트워크 구조를 탐구할 수 있다.
Most of the functional imaging studies described in this book could be labeled as studies of functional specialization. Functional specialization implies that a region responds to a limited range of stimuli/conditions and that this distinguishes it from the responsiveness of other neighboring regions. It is not strictly the same as localization, in that it is not necessary to assume that the region is solely responsible for performance on a given task or to assume that other regions may not also respond to the same stimuli/conditions (Phillips et al., 1984). Functional integration, on the other hand, refers to the way in whi different regions communicate with
ea other. is is likely to be essential for a full understanding of how cognition is linked to the brain, and also for dismissing claims that functional imaging is a new phrenology (Friston, 2002; Horwitz et al., 1999).
e basic approa of functional integration is to model how activity in different regions is interdependent. is is used to infer the effective connectivity or functional connectivity between regions when performing a task (these methods use teniques su as structural equation modeling and principal components analysis, whi are beyond the scope of the present discussion). If parametric designs correlate brain activity with some cognitive/behavioral measure, then designs employing functional integration correlate different regions of brain activity with ea other. To give a concrete example, Friston and Frith (1995) conducted an imaging study with a 2 · 2 factorial design with task instruction as one factor (generate words beginning with “A” versus repeating leers) and subject group as the other factor (participants either had or had not been diagnosed as sizophrenic). Although both groups showed a number of similar frontal and temporal lobe activities, there was a strong correlation between activity in these regions in controls and a striking absence of correlation in the sizophrenics. Friston and Frith argued that sizophrenia is best aracterized in terms of a failure of communication between distant brain regions (i.e. a functional disconnection).
One commonly used procedure for measuring functional integration does not use any task at all. ese are known as resting state paradigms. Participants are merely asked to lie ba and rest. In the absence of a task, the fluctuations in brain activity are lile more than noise. However, in brain regions that are functionally connected the noise levels tend to correlate together. is has enabled researers to identify sets of networks in the brain, consisting of spatially separated regions, for whi fluctuations in activity tend to be shared (Damoiseaux et al., 2006). For instance, one commonly studied network is called the default mode network of the brain and is implicated in internalized thoughts: for instance, it tends to be more active when not engaged in an experimental task (Raile et al., 2001). Differences in the way that these networks operate and are constructed are
found in various conditions su as sizophrenia and autism (Buner et al., 2008).
Key Terms
Functional integration
e way in whi different regions communicate with ea other.
Resting state paradigm
A tenique for measuring functional connectivity in whi correlations between several regions (networks) are assessed while the participant is not performing any tasks.
휴면 상태 패러다임은 참가자가 임의의 작업 없이 상태에 머무를 때 뇌 내 여러 영역 간 상관관계를 측정하여 기능적 연결성을 평가하는 기법이다.
Default mode network
A set of brain regions that is more hemodynamically active during rest than during tasks.
기본 모드 네트워크(DMN)는 자기 참조적 사고, 정신 이탈, 자전적 기억과 관련된 뇌 영역의 집합으로, 전두엽(medial prefrontal cortex), 후두연합구(posterior cingulate cortex), 각회(angular gyrus) 등이 포함된다.
Block design
Stimuli from a given condition are presented consecutively together.
특정 실험 조건 하에서 자극이 연속적으로 제시되는 실험 설계 방식이다.
Event-related design
Stimuli from two or more conditions are presented randomly or interleaved.
두 개 이상의 조건에 해당하는 자극을 무작위로 또는 교차적으로 제시하는 실험 설계 기법이다.
Event-related versus bloed designs
상호작용(Interaction)의 정의
하나의 독립변인이 종속변인에 미치는 영향이 다른 독립변인의 수준에 따라 달라질 때, 두 변인 사이에 **상호작용(interaction)**이 존재한다고 한다. 예를 들어, 과제 유형(단어 읽기 vs. 그림 명명)의 효과가 자극 빈도(고빈도 vs. 저빈도)에 따라 다르게 나타난다면, 이는 과제 유형과 자극 빈도 간의 상호작용이다. 기능적 영상 실험에서 상호작용은 순수 삽입(pure insertion) 가정이 위반될 때 발생하며, **요인 설계(factorial design)**를 통해 이를 명시적으로 검출하고 분석할 수 있다.
Summary
이 섹션에서는 실험 설계에서 블록 설계(block design)와 이벤트 관련 설계(event-related design)의 차이점을 중심으로 설명한다. 블록 설계는 동일한 조건에 속하는 자극들을 연속적으로 그룹화하여 제시하는 방식을 따르며, 반면 이벤트 관련 설계는 서로 다른 자극 또는 조건을 교차적으로 배치한 후 분석 단계에서 해당 조건을 분리하여 처리하는 방식을 사용한다. 이벤트 관련 설계는 자극의 시간적 분포를 유연하게 조절할 수 있는 장점이 있지만, 분석 시 각 조건 간의 혼합 효과를 제거하기 위한 복잡한 처리 과정이 필요하다는 점에서 기술적 한계를 지닌다. 두 설계 방식은 자극의 순서와 분석 전략에 따라 실험 결과의 해석 가능성에 직접적인 영향을 미치며, 특히 인지 과정의 시간적 특성 분석에 있어 선택적 적용이 중요하다.
A separate issue as to the oice of experimental design (e.g. categorical versus parametric) is how the different stimuli will be ordered. Broadly speaking, there are two oices. First, stimuli that belong together in one condition could be grouped together. is is termed a blo design. Second, different stimuli or conditions could be interspersed with ea other. is is termed an event-related design. In an event-related design the different intermingled conditions are subsequently separated out for the purpose of analysis.
Safety and Ethical Issues in Functional Imaging Research
Summary
이 섹션에서는 기능적 영상(functional imaging) 연구에서 발생할 수 있는 안전성과 윤리적 문제를 다루며, 특히 실험 참여자 보호, 데이터 관리, 신뢰성 확보 등의 핵심 이슈를 강조한다. 연구자들은 현지 기관의 규정을 준수하는 동시에, 실험 설계의 투명성, 참가자 동의 절차, 뇌 활성화 데이터의 비공개성을 보장하는 일반적인 원칙을 지켜야 한다는 점을 설명한다. 특히 기능적 영상 기술의 잠재적 위험(예: 뇌 자극 유발, 데이터 오용)을 최소화하기 위한 윤리적 프레임워크와 안전 프로토콜의 수립이 필수적이라고 강조하며, 이는 기존 섹션에서 다룬 실험 설계 방법론과의 연계성을 통해 연구의 신뢰성을 높이는 데 기여한다.
It is essential to be aware of the local regulations that apply in your own institution but the following points generally apply:
What are the risks of taking part in functional imaging experiments?
Summary
이 섹션에서는 기능적 영상 실험(functional imaging experiments)에 참여할 때 발생할 수 있는 위험 요소를 설명한다. PET(양전자 방출 단층 촬영)은 방사성 동위원소(radiolabelled tracer)를 사용하는 만큼 작은 수준의 방사선 노출(1~3년치 연간 배경 방사선량과 동등)이 발생하지만, fMRI(기능적 자기공명영상)는 방사선(ionizing radiation)을 사용하지 않아 반복 실험 참여가 가능하다. 또한 스캐너 소음(scanner noise)이 매우 크기 때문에 이어 보호기(ear protectors) 착용이 필수이며, 강력한 자기장(>3T) 환경에서는 현기증(dizziness)이나 질식(nausea)이 발생할 수 있어 점진적인 진입(gradual entry)이 권장된다.
e risks are small (PET) or negligible (fMRI). e risk from PET comes from the fact that it uses a small amount of radioactivity. e amount of radioactivity from a PET scan is equivalent to around 1–3 years of annual baground radioactivity. fMRI does not use radiation and the same participants can take part in multiple experiments. Participants wear ear protectors, given that the scanner noise is very loud. Larger magnets (> 3 T) can be associated with dizziness and nausea, and participants need to enter the field gradually to prevent this.
Are some people excluded from taking part in functional imaging experiments?
Summary
이 섹션에서는 기능적 영상(fMRI, PET) 실험 참여 시 참가자 선별 기준과 안전 절차를 설명한다. 임신 중인 여성, 어린이, 금속 부품(심장기, 임플란트, 탄도 조각)을 보유한 사람, 방사선(PET 실험의 경우)에 노출될 수 있는 대상자는 제외되며, 자석 강도가 높은 fMRI 장비 사용 시 화장(눈가의 화장은 열 발생으로 인한 태양광 화상 유사 증상 유발 가능), 피임 고환(contraceptive coil) 착용 여성의 검사 제한 등이 명시된다. 실험 시작 전 참가자와 연구자는 금속 물품(열쇠, 보석, 신용카드 등)을 제거해야 하며, 공포증(claustrophobia)이 있는 경우 제한된 공간에 장시간 머무르는 문제가 발생할 수 있어 사전 확인이 필수적이다. 또한, 실험 중 긴급 상황 발생 시 고무 공(rubber ball)을 눌러 실험자에게 신호를 보내는 시스템이 구비되어 있다.
Before entering the scanner, all participants should be given a elist that asks them about their current and past health. Pregnant women and ildren cannot take part in PET studies because of the use of radiation. People with metal body parts, colear implants, embedded shrapnel or pacemakers will not be allowed to take part in fMRI experiments. In larger magnets, eye make-up should not be worn (it can heat up, causing symptoms similar to sunburn) and women wearing contraceptive coils should not be tested. Before going into the scanner both the researer and participant should put to one side all metal objects su as keys, jewelry and coins, as well as credit cards, whi would be wiped by the magnet. Zips and metal buons are generally okay, but metal spectacle frames should be avoided. It is important to e that participants do not suffer from claustrophobia as they will be in a confined space for some time. Participants have a rubber ball that can be squeezed to signal an alarm to the experimenter, who can terminate the experiment if necessary.
What happens if a brain abnormality is detected during scanning?
Summary
이 섹션에서는 기능적 영상(functional imaging) 실험 중 뇌 이상(brain abnormality)이 발견될 경우의 윤리적 대응(ethical response)과 후속 조치(follow-up procedure)를 다룬다. 연구 과정에서 뇌종양(brain tumor)이나 예상치 못한 이상이 발견될 경우, 연구자는 참가자 재검사(subsequent scan)를 의무적으로 진행해야 하며, 신경학자(neurologist)나 임상적으로 자격을 갖춘 인력이 이상 사항(potential abnormalities)을 평가하고, 필요 시 참가자 및 의료진에게 통보해야 한다는 점을 강조한다. 특히 **Wolf et al. (2008)**은 비임상적 검사(non-clinical scanning) 중 부수적 이상(incidental finding)이 발생할 경우의 윤리적 가이드라인(ethics guideline)을 제시하며, 이와 같은 상황에서 참가자 보호(participant safety)와 정보 공개(information disclosure)의 균형을 유지해야 한다는 점을 논의한다. 이는 이전 섹션에서 다룬 실험 설계(experimental design) 및 기능적 영상(functional imaging)의 임상적 활용 범위와 연결되는 핵심 이슈로, 윤리적 프레임워크(ethical framework)의 구축을 위한 기초 자료로 작용한다.
ere is always a very small possibility that a brain tumor or some other unsuspected abnormality could be detected during the course of the study. In su instances, the researer has a duty to double-e this by inviting the participant ba for a subsequent scan. Potential abnormalities are followed up by a neurologist (or a clinically qualified member of staff), who would inform the participant and their doctor, if
needs be. Wolf et al. (2008) provide a set of ethics concerning the incidental discovery of abnormalities during non-clinical scanning.
How can I find up-to-date details about safety in fMRI experiments?
Summary
이 섹션에서는 fMRI 실험의 안전성 관련 최신 정보를 확인하기 위한 표준 참조 자료로 **Shello (2014)**의 보고서를 언급하며, 추가 자료는 www.magneticresonancesafetytesting.com에서 확인할 수 있다고 설명한다. 블록 설계(block design)와 이벤트 관련 설계(event-related design)의 장단점을 비교한 내용에서, 블록 설계는 통계적 검정력이 높아 미세한 효과를 탐지하는 데 유리하다는 점을 강조한다. 반면, 이벤트 관련 설계는 실험 조건의 유연성을 제공하며, 특히 인지 심리학 실험과 같은 일반적인 설계 구조에 더 부합한다고 설명한다. 예를 들어, **Maril et al. (2001)**의 연구에서는 tip-of-the-tongue 상태(단어를 기억하지만 추출하지 못하는 상태)를 조사할 때, 참여자의 주관적 카테고리(알고 있음, 모르고 있음, tip-of-the-tongue)를 사전에 묶을 수 없어 이벤트 관련 설계가 필수적이었다. 또 다른 예로, **Ffyte et al. (1998)**의 연구에서는 시각 환각이 자발적으로 발생하는 맹인 환자들을 대상으로, 환각 발생 시와 종료 시의 신경 활성화 차이를 비교하는 방식을 사용했다. 또한, 블록 설계가 불가능한 상황도 존재하며, 예를 들어 예측 불가능하거나 드문 이벤트를 조사할 때는 이벤트 관련 설계가 유일한 선택지가 된다. 마지막으로, 기능적 영상 실험 설계 시에는 실험 목적, 데이터 수집 방식, 통계적 분석 전략 등에 대한 다양한 질문을 고려해야 하며, 이에 대한 절차는 흐름도(flowchart) 형태로 제시된다.
e standard safety reference is by Shello (2014), and updates can be found at: www.magneticresonancesafetytesting.com.
In fMRI, the advantage of blo designs over event-related ones is that the method has more power; that is, it is more able to detect significant but small effects (Josephs & Henson, 1999). e advantage of event-related designs over bloed ones is that they enable a mu wider range of experimental designs and are more closely related to the typical design structure of most cognitive psyology experiments. Certain types of empirical question can be adequately addressed only with event-related designs. In some instances, there is no way of knowing in advance how events should be grouped and so blo designs are impossible. For example, one event-related fMRI study investigated participants in a tip-of-the-tongue state (Maril et al. 2001). In this state people are unable to retrieve a name (e.g. the capital of Peru) but have a strong certainty of knowing the answer. In a typical experiment, responses fall into three categories (known, unknown and tip-of-the-tongue). ese are defined by ea participant and cannot be bloed together at the outset. To give another example of events being defined by a participant, Ffyte et al. (1998) studied spontaneously occurring visual hallucinations in patients with progressive blindness. e patients lied their finger when a hallucination occurred and lowered it when it disappeared. e neural signal in the “on” phase could then be contrasted with the “off” phase. Finally, some events cannot be bloed because the task requires that they are unexpected and occur infrequently.
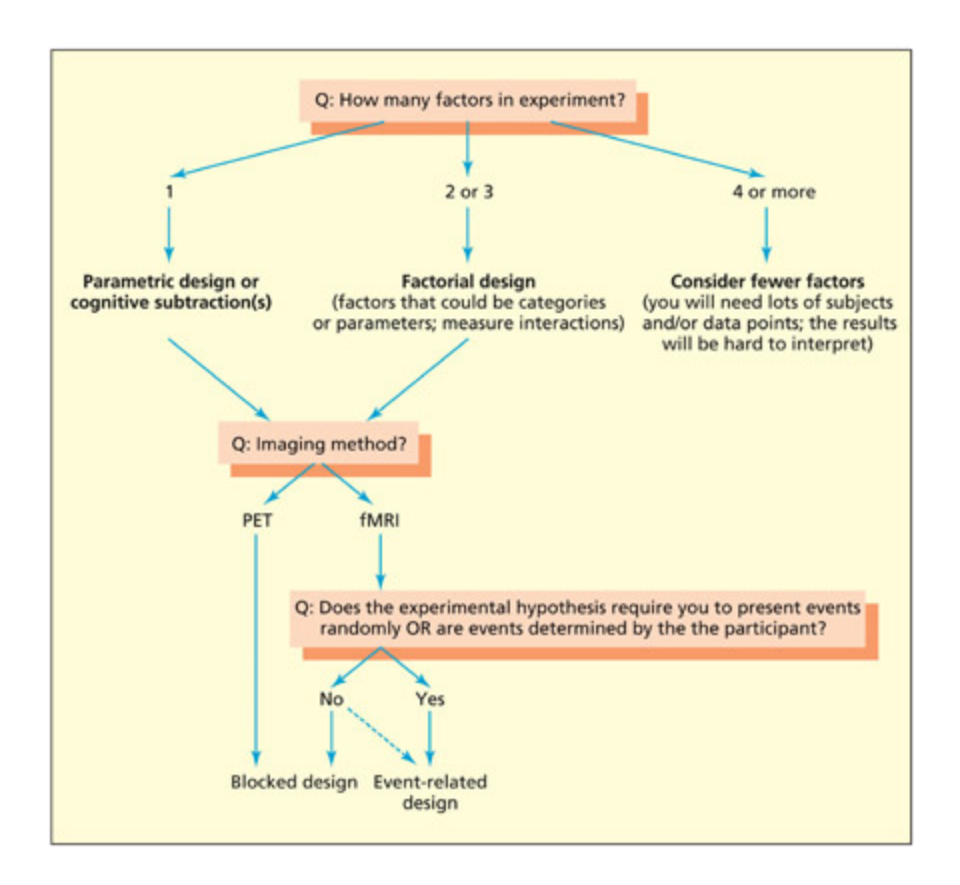
Seing up a functional imaging experiment requires asking oneself a number of questions, and making assumptions about the most appropriate method. is flowart is intended to be useful rather than prescriptive.
📊 그림 설명
기능적 영상 실험을 설계할 때 연구자가 고려해야 할 주요 질문들을 순서도(flowchart) 형태로 정리한 그림이다. 가설의 유형, 자극 제시 방식(블록 vs 이벤트 관련), 기준 조건 선택, 분석 방법 등 실험 설계의 각 단계에서 내려야 할 결정 사항들을 체계적으로 안내한다.
Evaluation
Summary
실험 설계 방법의 선택은 검증하려는 가설의 세부 수준에 따라 달라지며, 연구실마다 확립된 방법론이 다를 수 있고 새로운 기법이 지속적으로 개발되고 있다.
A number of different methods are available for seing up experiments in functional imaging. e main consideration is that the method should be appropriate for the hypothesis being tested (and the level of detail of the hypothesis will vary considerably). Having said this, the diagram on p. 65 offers a number of general points to consider and some suggested outcomes. Note that different labs may have other established methods and that the field itself is developing new methods all the time.
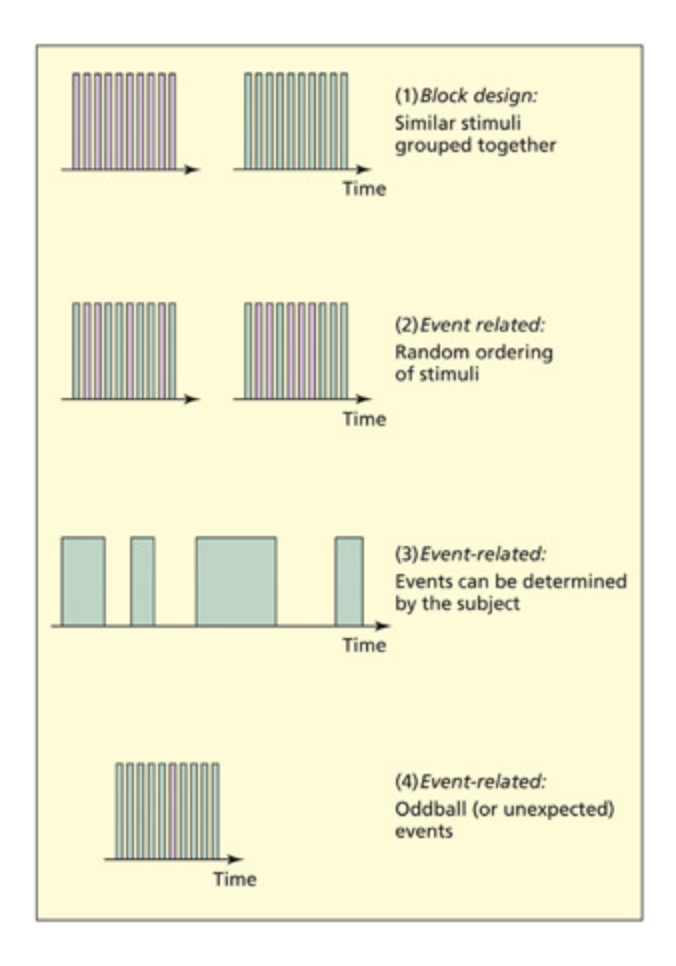
A comparison of blo designs versus event-related designs. e purple and green bars could represent different types of stimuli, conditions or task.
📊 그림 설명
블록 설계와 이벤트 관련 설계의 자극 제시 방식을 비교한 그림이다. 블록 설계에서는 동일 조건의 자극이 연속적으로 묶여 제시되는 반면, 이벤트 관련 설계에서는 서로 다른 조건의 자극이 무작위로 교차 배치된다. 보라색과 초록색 막대가 서로 다른 자극 유형 또는 실험 조건을 나타낸다.
Analyzing Data from Functional Imaging
Summary
이 섹션에서는 기능적 영상(functional imaging) 데이터 분석의 복잡성과 한계를 다루며, 생성된 뇌 이미지가 통계적으로 유의미한 활성화 영역(statistically significant activation regions)을 보여주는 통계적 결과임을 강조한다. 기능적 영상은 뇌의 신경 활동을 측정하는 통계적 과학(statistical science)으로, 실험 설계에 따라 다양한 데이터 처리와 통계 분석 단계를 거쳐 생성되지만, 이 과정에서 오류 가능성(susceptible to error)이 존재한다. 특히, 개인 간 차이(individual differences)는 피질의 크기(gyri size)와 뇌 유두(sulci location)의 위치 변화로 인해 분석에 큰 영향을 미치며, 예를 들어 유두 위치(sulci location)는 사람에 따라 1cm 이상(up to a centimeter) 차이날 수 있다. 또한, 시각 환각(visual hallucination)과 관련된 혈관 생성 반응 함수(hemodynamic response function)의 예시에서, 뇌 활성화가 의식 경험(conscious experience) 발생 12초 전(as much as 12 s)에 나타나는 현상이 보고되었으며, 이는 신경 생리학적 지연(neurophysiological delay)을 반영한다. 분석 과정에서 실험 설계(experimental design)와 통계적 방법(statistical methods)의 선택이 결과 해석에 중대한 영향을 미치며, 이에 대한 세부적인 논의는 Petersson et al.(1999a, 1999b)의 연구를 참조해야 한다.
e images of brains with superimposed colored blobs are the outcome of several stages of data processing and statistical analysis. In fact, these images are not literal pictures of the workings of the brain at all. What these images depict are the regions of the brain that are computed to be statistically significant given the type of design used. Functional imaging is a statistical science and, as su, is susceptible to error. Although different laboratories use different paages to analyze their data, the allenges faced in
analyzing and interpreting functional imaging data are common to them all (for a detailed discussion, see Petersson et al., 1999a, 1999b).
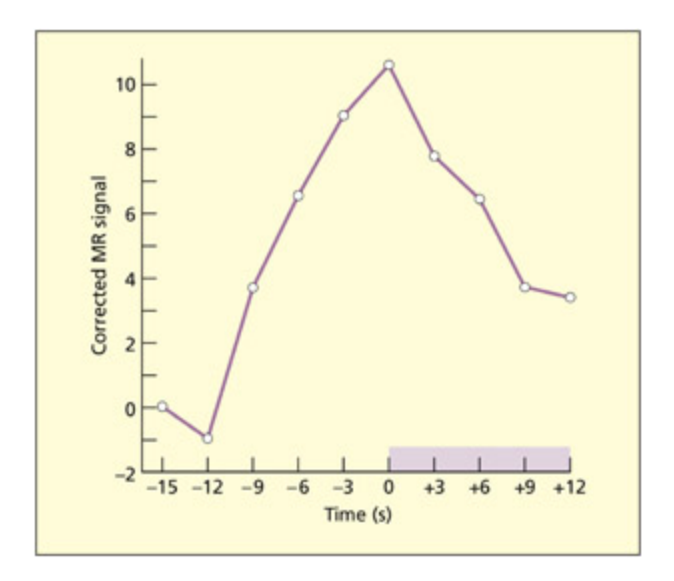
A hemodynamic response function related to the onset of visual hallucinations (at 0 s, shown by purple bar). is is derived by averaging together a number of hallucinations involving visual regions of the brain. Note how the brain activity precedes the onset of the conscious experience by as mu as 12 s. An example of a reported hallucination is as follows: “colored shiny shapes like futuristic cars or objects found in the pyramids. e shapes contained edges within them and did not look like real objects.”
From Ffyt et al., 1998. Reprinted by permission of Macmillan Publishers Ltd. © 1998.
📊 그림 설명
시각 환각 발생 시점(0초, 보라색 막대)을 기준으로 한 혈역학적 반응 함수(HRF)를 보여주는 그래프이다. 여러 환각 에피소드를 평균하여 시각 영역의 뇌 활동을 나타내며, 의식적 환각 경험이 시작되기 최대 12초 전부터 뇌 활동이 증가하기 시작하는 것을 확인할 수 있다.
A central problem faced in the analysis of functional imaging data is how to deal with individual differences. Although the gross brain structure does not differ considerably from one person to the next, there are nevertheless significant individual differences in the size of gyri and the location of folds in the brain. For example, the location of sulci can vary between people by a centimeter or more (ompson et al., 1996).
Key Terms
Stereotactic normalization
e mapping of individual differences in brain anatomy onto a standard template.
스테레오타크틱 정규화는 개별 뇌 영상을 표준 템플릿에 매핑하여 일관된 좌표계로 변환하는 핵심 전처리 단계로, 군집 분석과 대규모 데이터 비교를 가능하게 한다.
Smoothing
Redistributing brain activity from neighboring voxels to enhance the signal-to-noise ratio.
스무딩은 이웃 voxel 간 신호를 재분포하여 신호 대 잡음비를 향상시키고, 개체 간 해부학적 차이를 줄여 공통 활성화 영역 탐지를 용이하게 하는 전처리 단계이다.
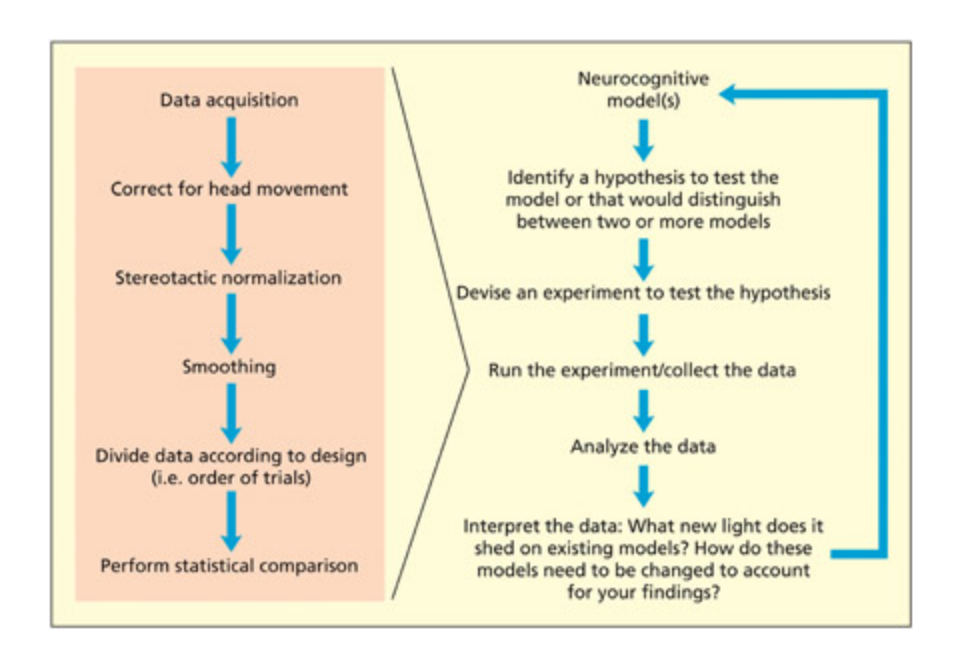
e main stages of analyzing data in a functional imaging experiment.
📊 그림 설명
기능적 영상 실험에서 데이터를 분석하는 주요 단계를 순서대로 나타낸 흐름도이다. 초기 가설 설정에서 시작하여 머리 움직임 보정, 스테레오타크틱 정규화(표준 뇌 템플릿에 매핑), 스무딩(신호 대 잡음비 향상), 통계적 비교 단계를 거쳐 최종 데이터 해석에 이르는 전체 분석 파이프라인을 보여준다.
e most common way of dealing with individual differences is effectively to assume that they do not exist. Or, more properly put, individual differences needn’t get in the way of making claims about general brain function. Individual differences are minimized by averaging data over many participants, and one is le with regions of activity that are common to most of us. Before this averaging process can occur, the data from ea
individual needs to be modified in a number of ways. First, ea brain is mapped onto a standard reference brain (called stereotactic normalization). is is followed by a process called smoothing, whi can enhance the signal-to-noise ratio and facilitates detection of common regions of activity across individuals. A flow diagram summarizes the sequence from initial hypothesis to data interpretation that typically occurs in a functional imaging experiment. ese main stages will be considered in turn.
Correction for head movement
Summary
이 섹션에서는 fMRI 기술의 공간 해상도 우수성과 함께 발생할 수 있는 두 가지 주요 문제를 다룬다. 첫째, 개인 간 뇌의 해부학적 차이(크기와 형태)로 인해 스테레오타크틱 정규화(stereotactic normalization)가 필요하다는 점을 강조하며, 둘째, 머리 움직임(head movement)으로 인해 활성화 영역이 흐려지거나 가짜 양성 결과(false-positive result)가 발생할 수 있는 위험성을 지적한다. 이를 해결하기 위해 물리적 고정(head restraint)과 참가자 지시를 통해 움직임을 최소화하고, 수집된 데이터에 대해 머리 움직임 보정(head movement correction)을 수행해야 한다는 점을 설명한다. 특히, **Brammer (2001)**의 연구를 인용하며, 이러한 보정 과정이 신뢰성 있는 fMRI 결과 도출에 필수적임을 강조한다.
Perhaps the biggest advantage of the fMRI te nique over others is its good spatial resolution. It is able to identify differences in activity over millimeter distances (although this resolution still entails millions of neurons). However, there is a downside to this; namely, that small spatial dis tortions can produce spurious results. One key problem that has already been noted is that every brain differs spatially in terms of size and shape. e process of stereotactic normalization aempts to correct for this. A different problem is that ea person’s head might be aligned slightly differently in the scanner over time. If a person wriggles or moves the head in the scanner, then the position of any active region will also move around. is could either result in the region being harder to detect (because the activity is being spread around) or a false-positive result could be obtained (because head movements may appear to shi an active region between consecu tive conditions). It is for this reason that the collected data are corrected for head movement (Brammer, 2001), whi is minimized in the first place by physically restraining the head in position, and instructing participants to keep as still as possible.
Key Terms
Voxel
A volume-based unit (cf. pixels, whi are 2D); in imaging resear the brain is divided into many thousands of these.
voxel(3차원 픽셀)은 2차원 이미지의 pixel과 달리 체적 기반 단위로, 뇌 영상 분석에서 뇌를 수천 개의 voxel로 나누어 해상도를 높인다.
Talaira coordinates
Locations in the brain defined relative to the atlas of Talaira and Tournoux.
Talaira 좌표는 뇌 내 위치를 Talaira 및 Tournoux 대장(atlas)에 기반한 표준화된 좌표 시스템으로 정의하며, 스테레오타크틱 정규화와 밀접한 관련이 있다.
Stereotactic normalization
e process of stereotactic normalization involves mapping regions on ea individual brain onto a standard brain. Ea brain is divided up into thousands of small volumes, called voxels (volume elements). Ea voxel can be given three-dimensional spatial coordinates (x, y, z). is enables every x, y, z coordinate on a brain to be mapped onto the corresponding x, y, z coordinate on any other brain. Basically, the template of ea brain is squashed or streted (by applying mathematical transformations that entail an optimal solution) to fit into the standard space. e standard space that is used to report functional imaging data across most laboratories in the world is provided by the brain atlas of Talaira and Tournoux (1988). Ea point in the brain is assigned a three-dimensional x, y, z coordinate (commonly referred to as the Talaira coordinates) with the origin lying at a region called the anterior commissure (small and easily seen in most scans). e xcoordinate refers to le and right (le is negative and right is positive). e y-coordinate refers to front and ba (front/anterior is positive and ba/posterior is negative) and the z-coordinate refers to top and boom (top is positive and boom is negative). is atlas is based on anatomical
data from a single post-mortem brain. However, rather than relying on comparisons to this single brain, many contemporary studies use a template based on an average of 305 brains provided by the Montreal Neurological Institute (Collins et al. 1994). is averaged template is then put into Talaira coordinates and used in favor of the single brain originally described in that atlas.
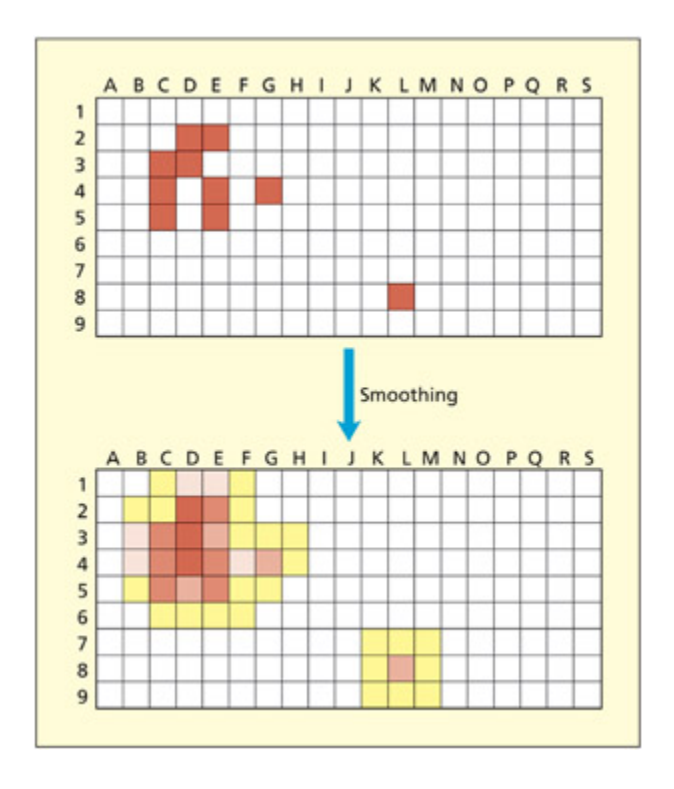
Smoothing spreads the activity across voxels—some voxels (e.g. D4) may be enhanced whereas others (e.g. L8) may be reduced.
📊 그림 설명
스무딩 과정에서 voxel 간 활성도가 재분포되는 원리를 격자 형태로 시각화한 그림이다. 어두운 사각형이 활성화된 voxel을 나타내며, D4 voxel은 주변의 활성 이웃들로부터 신호를 받아 활성화되고, L8 voxel은 비활성 이웃들에 의해 신호가 감소하는 예시를 통해 신호 대 잡음비 향상 효과를 설명한다.
Smoothing
Aer ea brain has been transformed into this standard space, further stages of preprocessing may take place before a statistical analysis. e process of “smoothing” sounds like it could waste important information, but it is an important part of data manipulation. Smoothing spreads some of the raw activation level of a given voxel to neighboring voxels. e closer the neighbor is, the more activation it gets (the mathematically minded
might be interested to know that the function used is a Gaussian or normal distribution centered on ea voxel). In the figure, the darker the square, the more active it is. Consider voxel D4. Prior to smoothing, this voxel is inactive, but because it has many active neighbors the voxel gets “swited on” by the smoothing process. In contrast, consider voxel L8. is voxel is initially active but, because it has inactive neighbors, it gets “swited off” by the smoothing process. Smoothing thus enhances the signal-to-noise ratio. In this instance, one assumes that the signal (i.e. the thing of interest) corresponds to the larger cluster of activity and the noise is the isolated voxel. Neighboring voxels that are active mutually reinforce ea other and the spatial extent (i.e. size) of the active region is increased. If the brain happened to implement cognition using a mosaic of non-adjacent voxels, then smoothing would work against detecting su a system. ere are, however, some statistical teniques (su as multi-voxel paern analysis, MVPA) that can be used to analyze this kind of neural representation that do not require smoothing (Norman et al. 2006). is is considered later.
As well as enhancing the signal-to-noise ratio, smoothing offers an additional advantage for analyzing groups of participants. Smoothing increases the spatial extent of active regions. As su, when averaging the activity across individuals there is a greater ance of finding common regions of activity. Of course, if individual differences are the focus of the study, then one may justifiably oose not to smooth the data at all.
Statistical comparison
Summary
이 섹션에서는 스테레오타크틱 정규화(stereotactic normalization), 스무딩(smoothing), 머리 움직임 보정(head movement correction)이 완료된 후 통계적 분석 방법을 설명한다. 기능적 영상(functional imaging) 데이터는 수만 개의 voxel(3차원 픽셀)로 구성되어 있어, 각 voxel의 실험 조건(experimental condition)과 기준 조건(baseline condition) 간 평균 활성도 차이를 검정하는 t-test와 같은 통계적 검정이 필요하다. 그러나 다중 비교 문제(multiple comparisons problem)로 인해 기존 심리학 실험에서 사용하는 P < 0.05의 유의 수준을 그대로 적용하면 수천 개의 voxel이 우연히 활성화된 것으로 인식될 수 있다. 이를 해결하기 위해 Bonferroni 교정(Bonferroni correction)을 통해 유의 수준을 voxel 수로 나누는 방식이 제안되나, 이는 활성화 영역(activation regions)의 검출률을 저하시킬 수 있는 Type I 오류(false negative) 위험을 동반한다. 대안으로, 공간적 매끄러움(spatial smoothness)을 고려한 Family Wise Error (FWE) 방법과 False Discovery Rate (FDR) 방법이 소개된다. FDR은 랜덤 데이터 생성을 통해 유의 수준을 조정하며, 활성화된 voxel이 많은 데이터셋에서는 보다 보수적인 통계적 임계값(conservative statistical threshold)을 적용한다. 이는 해양 수준(sea level)을 조절해 섬을 세는 것에 비유되며, 임계값이 너무 높으면 활성화 영역이 사라지고, 너무 낮으면 과도한 양성 결과가 발생하는 trade-off를 해결하는 핵심 기법이다.
Aer the data have been stereotactically normalized, smoothed and corrected for head movement, it is possible to perform a statistical analysis. e standard way to do this is to ask the question: “Is the mean activity at a particular voxel in the experimental condition greater than in the baseline condition?” e same types of statistical test as would be employed in any psyology experiment can be used in functional imaging (e.g. a t-test to compare means). But there are complications. In most psyology
experiments one would typically have, at most, only a handful of means to compare. In functional imaging, ea brain slice is divided up into tens of thousands of voxels and ea one needs to be considered. If one uses the standard psyology significance level of P < 0.05, then there would be thousands of brain voxels active just by ance. (Recall that the significance level represents the probability (P) at whi one is willing to say that a result is more than just a ance occurrence. e value of 0.05 represents a 1 in 20 ance level.) How could one prevent lots of brain regions being active by ance? One could have a more conservative criteria (i.e. a lower significance level), but the danger is that this will not detect regions that are important (this is termed a type I error). An analogy here would be trying to count islands by lowering or raising the sea level. If the sea level is too high, there are no islands to observe. If the sea level is too low, there are islands everywhere. One could divide the nominal P value (0.05) by the number of tests (i.e. voxels)— a so-called Bonferroni correction. A difficulty with this approa is that the activity at ea voxel is not inde pendent: neighboring voxels tend to have similar activity, particularly if smoothed. is has led to the development of sophisticated mathematical models of oosing a statistical threshold, based on spatial smoothness (so-called random field theory). is general method of correction is termed Family Wise Error (FWE). Other researers generate thousands of random brain images (e.g. by permuting the data) and select a threshold (e.g. P < 0.05) based on random datasets. is method of correction is termed the False Discovery Rate (FDR). In this method a more conservative statistical threshold would be used for datasets in whi lots of voxels are active than in a dataset in whi only few voxels are active.
Key Terms
Family Wise Error (FWE)
An approa for correcting for many statistical comparisons based on the number of tests being conducted.
False Discovery Rate (FDR)
An approa for correcting for many statistical comparisons based on the number of positive results obtained.
거짓 발견률(FDR)은 수많은 voxel 간의 활성도 차이를 평가하는 과정에서 가짜 양성(false positive) 비율을 통제하기 위해 사용된다.
Inhibition
A reduction/suppression of the activity of a brain region (or a cognitive process), triggered by activity in another region/process.
억제는 특정 뇌 영역 또는 인지 과정의 활성화가 다른 영역 또는 과정의 활동에 의해 감소하거나 억제되는 현상이다.
Excitation
An increase of the activity of a brain region (or a cognitive process), triggered by activity in another region/process.
흥분은 특정 뇌 영역 또는 인지 과정의 활성화가 다른 영역 또는 과정의 활동에 의해 증가하는 현상이다.
임상 사례
다중 비교 문제의 실제 위험을 보여주는 유명한 사례로, Bennett et al.(2009)이 죽은 연어(dead salmon)를 fMRI 스캐너에 넣고 사진을 보여준 실험이 있다. 다중 비교 보정 없이 분석하면 죽은 연어의 뇌에서도 “활성화”가 관찰되었다. 이 연구는 FWE나 FDR 보정의 필수성을 풍자적으로 입증한 것으로, 기능적 영상 논문을 읽을 때 보정 방법을 반드시 확인해야 함을 상기시켜 준다.
When reading papers that have used functional imaging methods, one sometimes observes that they report different significance levels that are “corrected” or “uncorrected.” Why is this done and is it acceptable? A corrected level implies that a more conservative criterion has been used to prevent detecting lots of regions just by ance. However, if the interest is in
one particular voxel, then it is possible to use an uncorrected significance level (e.g. the standard P < 0.05) because in this instance there are not multiple comparisons over lots of brain regions. Other procedures are used when investigating effects in a predetermined region covering several voxels (a so-called small volume correction).
Interpreting Data from Functional Imaging
Summary
이 섹션에서는 기능적 영상 실험(functional imaging experiment)에서 특정 뇌 영역(brain region)이 활성화되었다는 의미를 탐구하며, BOLD 신호(Blood Oxygen Level-Dependent signal)가 비교 조건에 비해 증가하는 현상이 반드시 해당 작업에 필수적인 뇌 영역의 활성화를 의미하지 않음을 강조한다. 활성화의 원인으로는 참가자의 전략적 선택, 일반적인 인지 메커니즘(예: 주의 집중 증가), 또는 억제(inhibition) 상태(입력은 받되 반응하지 않는 경우) 등 다양한 가능성을 제시한다. 이러한 경쟁적 시나리오를 배제하기 위해서는 실험의 엄밀성(rigorous experimentation)과 결과 재현성(replication)이 필수적이며, 특정 뇌 영역의 작업 필수성은 손상 연구(lesion methods)를 통해 판단할 수 있다고 설명한다. 특히, 통계적 유의성(statistical significance) 외에도 생물학적 해석(biological interpretation)의 한계와 실험 설계의 복잡성이 활성화 해석에 중요한 영향을 미친다는 점을 강조한다.
What does it mean to say that a brain region is active in a functional imaging experiment? Literally speaking, what this means is that the signal from that region (the BOLD signal in fMRI) is greater in one condition than in other conditions that are being compared (whether in a categorical design, parametric design or whatever). ere are several reasons why a region may be active and not all of them are theoretically interesting. Importantly, it need not imply that the particular region is essential for the task. Alternative accounts include: an increase in signal could reflect the strategy that the participants happen to adopt, it could reflect use of some general meanism (e.g. increased aention) that is not specific to the task, or it could reflect the fact that a region is receiving input but is not responding to the input (i.e. inhibition). ese competing scenarios can only be ruled out with more rigorous experimentation. Chance occurrences can be ruled out by replicating the results and the necessity of a region for a task can be determined using lesion methods. is is discussed in more detail below.
Inhibition versus excitation
Summary
이 섹션에서는 기능적 영상(fMRI) 신호가 뉴런과 시냅스의 대사 활동과 연관되어 있다는 가정 하에, 억제(inhibition)와 흥분(excitation)의 두 가지 신경 활성화 메커니즘 간의 차이를 탐구한다. 특히, 흥분성 시냅스(excitatory synapses)는 전달자 뉴런의 활동이 수용체 뉴런을 활성화시키는 반면, 억제성 시냅스(inhibitory synapses)는 수용체 뉴런의 활동을 억제하는 방식으로 작동하며, 이 두 과정 모두 대사 활동을 동반한다. Logo thetis et al.(2001)의 연구에 따르면, BOLD 신호(Blood Oxygen Level-Dependent signal)는 특정 영역으로의 입력 신호(input)에 더 민감하게 반응하며, 이로 인해 해당 영역이 다른 활성화 영역의 신호를 수신만 하고 자체적으로 반응하지 않는 경우도 활성화 영역(activation region)으로 오해될 수 있다. 이는 기능적 영상(functional imaging)이 억제와 흥분의 생리학적 변화를 구분하기 어려운 한계를 드러내며, 특히 억제된 영역(inhibited region)이 실질적인 활성화로 오인될 수 있는 위험성을 강조한다. 이에 따라, 기능적 영상 기술의 해석에서 신경 활성화 방식(neuronal activation mode)에 따른 차이를 명확히 구분하는 것이 필수적이라고 지적한다.
Functional imaging signals are assumed to be correlated with the metabolic activity of neurons, and synapses in particular (see Jueptner & Weiller, 1995). However, neurons can be metabolically active by virtue of both inhibitory
interactions (when the presynaptic neuron is active, the post synaptic neuron is swited off) and excitations (when the presynaptic neuron is active, the postsynaptic neuron is swited on). Most connections are excitatory in nature. Logo thetis et al. (2001) demonstrated that the BOLD signal used in fMRI is more sensitive to the neuronal input into a region rather than the output from the region. us, regions that “listen” to other active regions but do not themselves respond to it could appear as areas of activation.
It is unclear whether functional imaging can distinguish between these two types of neural function since both are assumed to be associated with similar physiological anges.
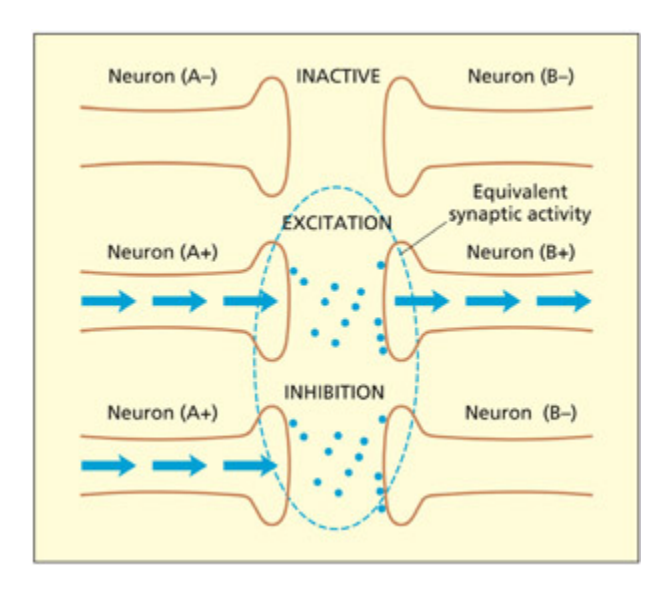
📊 그림 설명
흥분성 및 억제성 시냅스 연결이 모두 대사 활동을 수반하는 과정을 도식화한 그림이다. 흥분성 시냅스에서는 시냅스 전 뉴런의 활동이 시냅스 후 뉴런을 활성화시키고, 억제성 시냅스에서는 시냅스 후 뉴런의 활동을 억제한다. 두 과정 모두 대사 활동을 유발하므로 fMRI에서 억제된 영역이 활성화 영역으로 잘못 해석될 수 있음을 보여준다.
Excitatory and inhibitory synaptic connections both involve metabolic activity and thus an inhibited region could be mistakenly interpreted as a region of activity.
Activation versus deactivation
Summary
이 섹션에서는 활성화(activation)와 비활성화(deactivation)가 두 조건 간 신호 차이의 부호(양수 또는 음수)를 나타내는 개념임을 설명한다. 이는 흥분(excitation)과 억제(inhibition)와는 구분되어야 하며, 후자는 신경 세포 간 의사소통의 본질적인 메커니즘을 의미한다. 예를 들어, 실험 조건 A - 조건 B의 차감을 수행할 경우, 조건 A에서 더 활성화된 뇌 영역은 양성 효과(positive effect)로 나타나며, 조건 B에서 더 활성화된 영역은 음성 효과(negative effect)로 표시된다. 차감 순서를 뒤바꾸면 동일한 영역이 식별되나, 부호가 반대로 나타나는 것이 특징이다. 그러나 이러한 활성화/비활성화의 방향성은 이론적 해석에 따라 달라질 수 있으며, 특히 기준 조건(baseline task)이 실험 조건과 차이가 클 경우 해석이 어려워질 수 있다.
Activation and deactivation simply refer to the sign (positive or negative) of the difference in signal between two conditions. is is not to be confused with excitation/inhibition that refers to the nature of the meanism by whi neurons communicate. If the subtraction (Task A) – (Task B) is
performed, there could be a set of regions that show a significant positive effect (i.e. “activation”) because they are used more in Task A than in Task B, and there could also be a set of regions that show a significant negative effect (i.e. “deactivation”) because they are more active in Task B than in Task A. Of course, if one had done the subtraction (Task B) – (Task A), then the same regions would be identified, but the positive and negative signs would merely swap. us, the terms activation and deactivation merely refer to whether there is a difference in signal between conditions and the direction of that difference. e question of why there is a difference is open to theoretical interpretation. If the baseline task is very different from the experimental conditions, the activations and deactivations may be very hard to interpret.
Key Terms
Activation
An increase in physiological processing in one condition relative to some other condition(s).
활성화는 특정 조건 간 생리학적 처리량의 증가로 정의되며, BOLD 신호의 변화를 통해 측정된다.
Deactivation
A decrease in physiological processing in one condition relative to some other condition(s).
비활성화는 특정 조건에서 생리학적 처리량의 감소로 정의되며, 기준 조건에 비해 BOLD 신호가 감소하는 현상이다.
Necessity versus sufficiency
Summary
이 섹션에서는 기능적 영상(functional imaging)의 한계 중 필수성(necessity)과 충분성(sufficiency)의 구분 문제를 중심으로 논의한다. Kosslyn(1999)의 논문에서 지적된 바와 같이, 특정 작업 수행 시 활성화된 뇌 영역이 반드시 해당 작업의 필수적인 요소일 필요는 없으며, 참가자의 전략 선택이나 작업의 일반적 특성(예: 난이도 차이)으로 인해 발생할 수 있다. 예를 들어, 더 어려운 작업이 주의 집중을 요구하는 경우, 이는 작업 수행에 도움이 될 수 있지만 본질적으로 필수적인 요소는 아닐 수 있다. 이로 인해 기능적 영상은 특정 작업에 충분한 조건(sufficient condition)을 제공하는 데 유리하지만, 필수적 요소(necessary condition)를 명확히 파악하는 데는 한계가 있다. 또한, 기능적 영상과 손상 기반 신경심리학(lesion-based neuropsychology)의 논리적 차이를 강조하며, 후자는 손상 위치를 조절해 행동 변화를 관찰하는 반면, 전자는 작업 조건을 조절해 뇌 활성화 변화를 분석하는 방식으로, 두 접근법은 서로 보완적이며 대체할 수 없다는 점을 설명한다. 이에 따라, 기능적 영상 데이터는 다른 방법과의 통합을 통해 그 가치를 극대화해야 하며, 그림 46은 두 방법의 논리적 차이와 상호보완성을 시각적으로 보여준다.
In an intriguingly titled paper, “If neuroimaging is the answer, what is the question?”, Kosslyn (1999) sets out some of the reasons why functional imaging has its limitations. One particular point that will be pied up on here is the notion that some of the regions that appear active may indeed be used during performance of the task but yet might not be critical to the task. For example, a region may appear to be active because of a particular strategy that the participants adopted, even though other strategies might be available. It could also be the case that the tasks being compared differ in some other, more general, way. For example, if one task is harder than the other it could demand more aention, and this demanding of aention would have its own neural correlate. Although paying more aention could certainly help with the performing of the task, it may not in and of itself be crucial for performing the task. As su, it has been claimed that functional imaging gives us a beer idea of whi regions may be sufficient for performing a particular task but not always whi regions are crucial and necessary for performing a task.
e value of functional imaging data is likely to be enhanced when it is used in conjunction with other methods. One early benefit of functional imaging was mooted to be that it could replace lesion-based neuropsyology. However, this is unlikely to happen because the logic of inference is different in these two methods, as illustrated on p. 72. In lesionbased neuropsyology, the location of the lesion is manipulated (or selected for in a patient sample) and the resulting behavior is observed. In doing this, a causal connection is assumed between the lesion and the ensuing behavior. In functional imaging the reverse is true. In this instance, the task given to participants in the scanner is manipulated and anges in brain regions are observed. Although some of these anges are likely to be critically related to the performance of the task, other anges may be incidental to it. It is for this reason that functional imaging is unlikely to supplant the traditional lesion-based approa. e next section discusses in more detail how divergent results between imaging and neuropsyology could be reconciled.
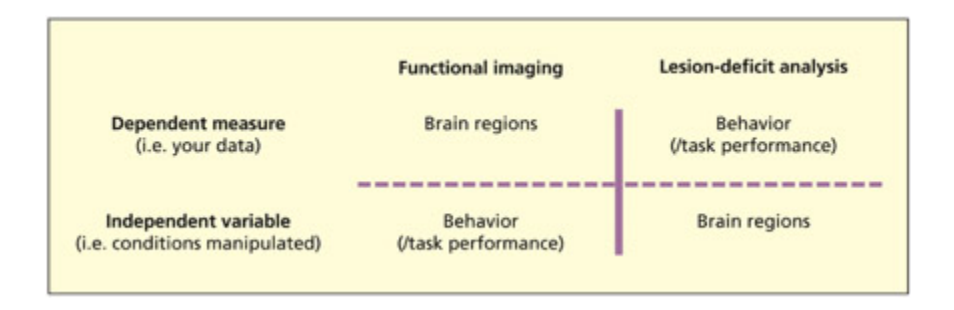
📊 그림 설명
기능적 뇌 영상과 손상-결핍 분석(또는 TMS)의 논리적 차이를 비교한 다이어그램이다. 손상 연구에서는 뇌 손상 위치를 독립 변수로, 행동 변화를 종속 변수로 설정하여 인과 관계를 추론하는 반면, 기능적 영상에서는 과제를 조작하여 뇌 활성화 변화를 관찰한다. 두 방법론은 상호 보완적이며 하나가 다른 하나를 대체할 수 없음을 시각적으로 설명한다.
Functional brain imaging and lesion-deficit analysis of patients (or TMS, see Chapter 5) are logically different types of methodology. It is unlikely that one will supplant the other.
시험 팁
충분성(sufficiency) vs 필수성(necessity) 구분은 에세이 문제의 핵심이다. fMRI는 “이 영역이 과제 수행에 충분한(sufficient) 조건의 일부인가?”에 답하고, 손상 연구(lesion study)는 “이 영역이 과제에 필수적(necessary)인가?”에 답한다. 논리적으로 독립 변수(IV)와 종속 변수(DV)가 뒤바뀐다: fMRI에서는 과제가 IV이고 뇌 활성화가 DV이지만, 손상 연구에서는 손상 위치가 IV이고 행동 변화가 DV이다.
Why Do Functional Imaging Data Sometimes Disagree with Lesion Data?
Summary
이 섹션에서는 기능적 영상(functional imaging) 데이터와 손상 데이터(lesion data) 간의 불일치 현상을 두 가지 주요 시나리오로 분류하고, 각각의 원인과 해결 방향을 논의한다. 첫 번째 불일치는 기능적 영상이 특정 작업에서 뇌 영역의 활성화를 보고하지만, 손상 연구(lesion studies)는 해당 영역이 작업에 필수적이지 않다고 보여주는 경우로, 이는 참가자의 전략 차이, 일반 인지 자원의 활용, 또는 억제(inhibition) 현상 등으로 설명될 수 있으며, 손상 연구의 통계적 검증력 부족도 원인일 수 있다. 두 번째 불일치는 기능적 영상이 특정 영역의 활성화를 보고하지 않지만, 손상 데이터가 해당 영역이 작업에 핵심적이라고 보여주는 경우로, 실험 설계의 한계, 활성화 신호의 미세함, 또는 백질 섬유(white matter tracts) 손상에 따른 기능 저하 등이 원인일 수 있다. 이는 기능적 영상과 손상 데이터 모두의 한계를 반영하는 것으로, 불일치는 이론적 흥미를 위한 자료로 간주되어야 하며, 더 엄격한 실험 설계(more rigorous experimentation)를 통해 해결해야 한다는 점을 강조한다. 예를 들어, **Henson(2005)**의 연구는 이러한 불일치의 사례를 구체적으로 설명하며, 다음 섹션에서는 관련 문헌에서의 실제 예시를 제시한다.
ere are two broad scenarios in whi functional imaging data and lesiondeficit data can disagree. ese are listed below, together with possible ways of resolving the disagreement, as described in the following box.
Disagreement 1: Imaging data imply that a brain region is used in a given task, but lesion data suggest that this region is not essential to the task (imaging +, lesion –)
Possible reasons for disagreement:
- e activated region reflects a particular strategy adopted by the participants that is not essential to performing the task.
- e activated region reflects the recruitment of some general cognitive resource (e.g. due to increased task difficulty, aention or arousal) that is not specific to the task.
- e activated region is being inhibited (i.e. swited off) rather than excited (i.e. swited on).
e lesion studies have not been powerful enough to detect the importance of the region (e.g. too few patients, lesion not in correct location, tasks used with patients not the same as those used in imaging).
Disagreement 2: Imaging data imply that a brain region is not used in a given task, but lesion data suggest that this region is critical to the task (imaging –, lesion +)
Possible reasons for disagreement:
- If the experimental task and baseline task both depend critically on this region, then a comparison between them might produce an artifactual null result.
- It might be intrinsically hard to detect activity in this region of the brain (e.g. it is a very small region, it is in different places in different individuals or genuine activity produces a small signal ange).
- e impaired performance aer lesion reflects damage to tracts passing through the region rather than the synaptic activity in the gray maer of the region itself.
e above discussion thus highlights the fact that disagreements between results from functional imaging and results from lesion data could lie with imaging results, with the lesion results, or with both. ere is no magic solution for resolving the disagreements except through more rigorous experimentation. Ea method has some relative merit. As su, disagreements should be viewed as something that is potentially of theoretical interest rather than dismissed as a failure of one or other method (Henson, 2005). To provide a feel for how this might be aieved, the next section considers a concrete example from the literature.
Key Terms
Semantic dementia
A progressive loss of information from semantic memory.
세마틱 디멘시아는 의미 기억에서 정보가 점진적으로 손실되는 신경퇴행성 질환으로, 주로 전두엽과 두정엽의 atrophy와 관련이 있다.
Semantic memory
Conceptually based knowledge about the world, including knowledge of people, places, the meaning of objects and words.
세마틱 메모리는 세계에 대한 개념적 지식(예: 사람, 장소, 물체, 단어의 의미)으로, 기능적 영상(fMRI)과 구조적 영상 기법을 통해 분석되는 핵심 인지 기능이다.
Having your cake and eating it
Summary
이 섹션에서는 세마틱 디멘시아(semantic dementia) 환자의 기능적 손상(functional lesion)이 주로 세마틱 메모리(semantic memory) 시스템에 영향을 미친다는 점을 강조하며, VBM(voxel-based morphometry) 기반의 해부학적 손상(anatomical lesion) 연구에서 좌측 전두하엽(left anterior temporal lobe)의 atrophy(atrophy)와 세마틱 메모리 손상의 상관관계를 보고한다. 그러나 기능적 영상(functional imaging) 실험에서는 이 영역이 아닌 좌측 하측 전두회(left inferior frontal gyrus)가 활성화되는 경우가 많아, 이에 대한 원인을 탐구한다. **Petersen et al. (1988)**의 실험에서 동사 생성(verb generation)과 단어 읽기(reading aloud) 조건을 비교한 결과, 좌측 하측 전두회가 활성화되었으나, 이는 세마틱 메모리 손상과 연관된 좌측 전두하엽과는 다른 영역이다. **Thompson-Sill et al. (1998)**의 연구에 따르면, 좌측 하측 전두회 손상 환자는 고선택성 요구(high selection demand)의 동사 생성 작업에서 어려움을 보이며, 이는 전략적 정보 회수(strategic retrieval)에 관여하는 역할을 한다는 점을 시사한다. 반면, 좌측 전두하엽은 세마틱 정보 저장(semantic storage)에 더 밀접한 것으로 보이며, 손상 시 더 심각한 세마틱 메모리 손상이 나타난다. Petersen et al.(1988)의 실험에서 단어 읽기(reading)가 세마틱 저장에 의존할 수 있다는 점을 고려하면, 동사 생성과 단어 읽기 조건의 비교는 서로 상쇄되어 세마틱 저장 영역의 활성화를 유발하지 못했을 가능성도 제기된다. 이와 같은 차이를 통해 기능적 영상과 손상 데이터(lesion data)의 상호보완적 역할이 강조된다. 섹션의 후반부에서는 기능적 영상(fMRI)이 뇌 활동을 기반으로 사고 내용(thought content)을 예측하거나 거짓말 탐지(lie detection)에 활용될 수 있는 잠재력을 언급하며, **Haxby et al. (2001)**과 **O’Craven & Kanwisher (2000)**의 연구를 예로 들어, 개체 분류(object classification)와 상상(imagination)을 위한 뇌 활동 분석(neural activity analysis)의 가능성을 제시한다. 이는 인지 신경과학(cognitive neuroscience)에서 다양한 방법론(methodologies)의 통합적 활용이 중요하다는 점을 강조한다.
A small proportion of unfortunate people in later life start to lose the meanings of words and objects that they previously understood. is deterioration can spare, at least in the early stages, memory for events, calculation abilities, and syntax, among other things (e.g. Hodges et al., 1992). ese patients would probably be given a diagnosis of semantic dementia, because their functional lesion is primarily in the semantic memory system that stores the meaning of words and objects. Where are the anatomical lesions in these patients? Lesion studies based on voxel-based morphometry (VBM) have shown that the degree of semantic memory impairment is correlated with the amount of atrophy in the le anterior temporal lobe (Mummery et al., 2000). Given this finding, it would be encouraging if functional imaging studies also activated this particular region when healthy (non-brain-damaged) people are given semantic memory tasks. However, this has not always been the case and a number of
studies have reliably shown activation in a different region—the le inferior frontal gyrus (also referred to as the ventrolateral prefrontal cortex). How can these divergent results be explained? It will be argued that a more careful comparison of the tasks used can account for this divergence and reveals, in turn, more about how the brain supports semantic memory.
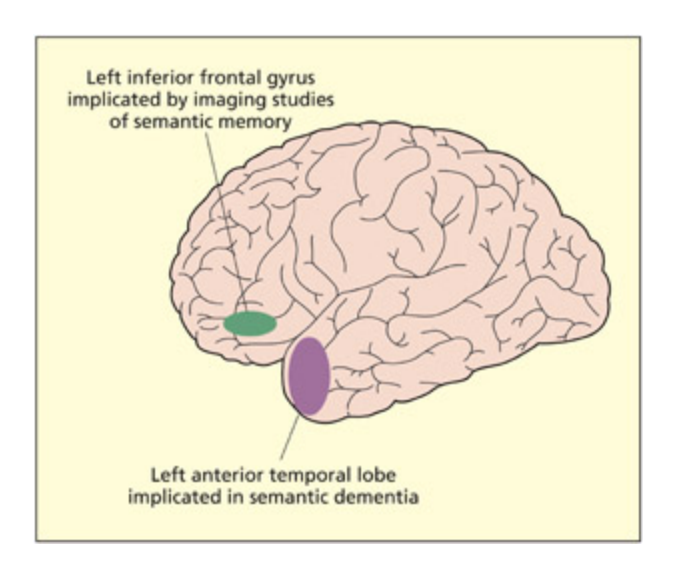
📊 그림 설명
세마틱 메모리(의미 기억) 연구에서 뇌 손상 환자 연구와 기능적 영상 연구가 서로 다른 뇌 영역을 강조하는 불일치 현상을 보여주는 그림이다. 손상 연구(VBM)는 좌측 전측두엽의 위축과 의미 기억 손상의 상관관계를 보고하는 반면, 기능적 영상 연구는 좌측 하전두회를 활성화 영역으로 지목한다. 이 불일치는 두 방법론의 상호 보완적 역할을 부각시킨다.
Studies of brain-damaged patients with semantic memory and imaging studies of semantic memory have not always highlighted the importance of the same regions.
One of the first ever functional imaging studies of cognition tried to address the question of where semantic memories are stored. As already discussed, Petersen et al. (1988) compared brain activation in two tasks: verb generation (e.g. the participant sees CAKE and says “eat”) and reading aloud (e.g. the participant sees CAKE and says “cake”). e verb-generation task is assumed to tap semantic memory more than the reading task. However, a comparison of the two tasks shows activity in regions of the le inferior frontal gyrus, but not in the same regions that are associated with semantic memory loss. Is the imaging data or the lesion data to be believed? Could it be the case that the le inferior frontal gyrus is really involved in semantic memory? To test this hypothesis, instead of taking a group of patients with semantic memory difficulties and asking where the lesion is, one would need to take a group of patients with selective lesions to the le inferior frontal gyrus and give them the same verb-generation task as the healthy people
were given when they were scanned. As it turns out, su patients do have subtle but real difficulties with these tasks. ompson-Sill et al. (1998) asked these patients to generate verbs that had either a low selection demand (e.g. scissors?), in whi most people agree upon a verb (i.e. cut), and words with a high selection demand (e.g. cat?), whi do not suggest an obvious single answer. e patients are impaired on the laer but not the former. More extensive imaging data on controls shows that the region is responsive to the difficulty of semantic memory retrieval (ompson-Sill et al., 1997, 1999). us, this disagreement is perhaps more apparent than real. e reason why patients with damage to the le inferior frontal gyrus do not show clinical symptoms of semantic memory impairment is because the region is involved in strategic retrieval operations from semantic memory when no obvious answer comes to mind. By contrast, the temporal regions may be the store of semantic information and lesions here can produce more devastating impairments of semantic knowledge. So why didn’t these particular imaging studies activate regions that are putatively the store of semantic knowledge? One possibility could be the baseline that was used. Petersen et al. (1988) compared verb generation (their semantic task) with reading (their putatively non-semantic task). However, if word reading does depend on the semantic store, and there is in fact good evidence that it might (Woollams et al. 2007), then the two conditions would cancel ea other out when subtracted away.
In this instance, an initial discrepancy between functional imaging and lesion data has resulted in a more complete understanding of how semantic memory is both stored and retrieved. is is a nice example of how the strengths of different methodologies can be combined in cognitive neuroscience.
Brain-Reading: Is “Big Brother ” Round the Corner?
is apter started with the specter of functional imaging being used to reveal one’s innermost thoughts to the outside world. It therefore seems appropriate to return to this interesting theme in light of the various points raised so far. It should by now be clear that the process of analyzing and interpreting data produced by functional imaging is not straightforward. It entails a number of stages, ea with its own assumptions, rather than a literal reading of the MR signal. Nonetheless, the tenology is still relatively new and the amount of progress that has already been made is substantial. Even at this early stage, there are serious studies exploring how functional imaging could be used as a lie detector and studies that try to predict the content of another person’s thoughts at some basic level (for a review, see Haynes & Rees, 2006).
It is generally believed that different classes of objects (e.g. faces, places, words, tools) activate somewhat different regions of the brain. So is it possible to infer what someone is looking at from brain activity alone? A number of studies have aempted to guess, in a third-person way, what a person is observing (Haxby et al., 2001) or imagining (O’Craven & Kanwisher, 2000) on a particular trial using only the concomitant neural activity. To aieve this, ea person requires pretesting on a whole range of objects to determine the average response to that class of objects relative to some baseline (e.g. all the other objects). Rather than locating the peak area of activity (as in regular fMRI analysis), one can examine the pattern of activation over a distributed set of voxels to enable a more fine-grained

📊 그림 설명
뇌 활동만으로 사람이 관찰하거나 상상하고 있는 대상을 추론하는 뇌 읽기(brain-reading) 연구를 보여주는 그림이다. Haxby et al.(2001)의 연구에서 얼굴, 장소, 도구 등 서로 다른 객체 범주가 각각 고유한 분산 활성화 패턴을 생성하며, 이 패턴을 기반으로 참가자가 보고 있는 대상을 96% 정확도로 예측할 수 있음을 나타낸다.

📊 그림 설명
모든 거짓말이 동일하게 탐지되기 어려움을 보여주는 그림이다. 거짓말은 타인의 마음 상태를 이해하는 마음 이론(theory of mind), 진실된 반응의 억제, 그리고 대안적 반응의 생성 등 복합적인 인지 과정을 수반한다. fMRI를 활용한 거짓말 탐지 연구에서 전방 대상 피질 등의 활성화가 관찰되지만, 미리 암기된 거짓말은 다른 뇌 영역을 사용한다.
Not all lies are as easy to detect.
Lying appears to be a normal component of human social interaction. It is likely to be composed of several cognitive components. For example, it requires an understanding that other people can have states of mind that are different from one’s own (so-called theory of mind). Lying also requires an ability to inhibit a truthful response and generate a plausible alternative response. Given this complexity, there will probably be no single “deception module” in the brain dedicated specifically to lying. Nevertheless, there is every reason to believe that studying the brain during deception might lead to more reliable indices of lying than the traditional lie detector (or “polygraph”), given that the brain is the organ that produces the lie in the first place.
e traditional polygraph monitors a number of bodily responses, including sweating, respiration and heart rate, whi are considerably downstream from the thought process that creates the lie. As these measures are associated with increased arousal generally (e.g. anxiety), they cannot exclusively detect guilt and their usage is highly questionable. Also, if a liar does not feel guilty there may be no strong arousal response.
A number of studies have used fMRI to measure the neural correlates of deception (Ganis et al., 2003; Langleben et al., 2002). When participants are asked to generate a spontaneous lie to a question (e.g. “Who did you visit during your vacation?”, “Was that the
card you were shown before?”), a number of regions are activated, including the anterior cingulate cortex. is region is of particular interest in this context, because it has been implicated in monitoring conflicts and errors (Carter et al., 1998) and also in generating the kinds of bodily response that formed the basis of the traditional polygraph (Critley et al., 2003). However, not all types of deception may recruit this region. Ganis et al. (2003) found that, if participants memorized a lie in advance of being interviewed in the scanner, then this region was not involved, but regions involved in memory retrieval were involved. us, to conclude, although fMRI might have some use in lie detection it is unlikely to offer a simple solution to this complex and important real-world problem (Sip et al. 2007).
Key Terms
Multi-voxel pattern analysis (MVPA)
An fMRI analysis method in whi distributed paerns of activity are linked to cognitive processes.
MVPA는 분산된 신경 활성화 패턴을 기반으로 인지 과정과 연관성을 탐구하는 fMRI 분석 기법으로, Haxby et al.(2001)의 연구에서 96% 정확도로 범주를 예측하는 데 성공했다.
approa. is method is called MVPA or multi-voxel pattern analysis (for a review see Tong & Prae, 2012). For example, Haxby et al. (2001) gave participants pictures from eight different types of category, including cats, houses, faces, and shoes. e neural activity from an individual trial was then compared to the previous known paerns of activity to determine the most probable category that was being viewed. is procedure could predict, given pairwise comparisons, what the person was seeing with 96 percent accuracy. e same regions of the brain are used, to some extent, when thinking about objects even when they are not physically seen. O’Craven
and Kanwisher (2000) obtained comparable results on individual imagery trials. Other resear has shown that activity in these regions can be used to accurately predict semantic categories when reading words (Mitell et al., 2008) or when recalling previously seen images from memory (Polyn et al., 2005).
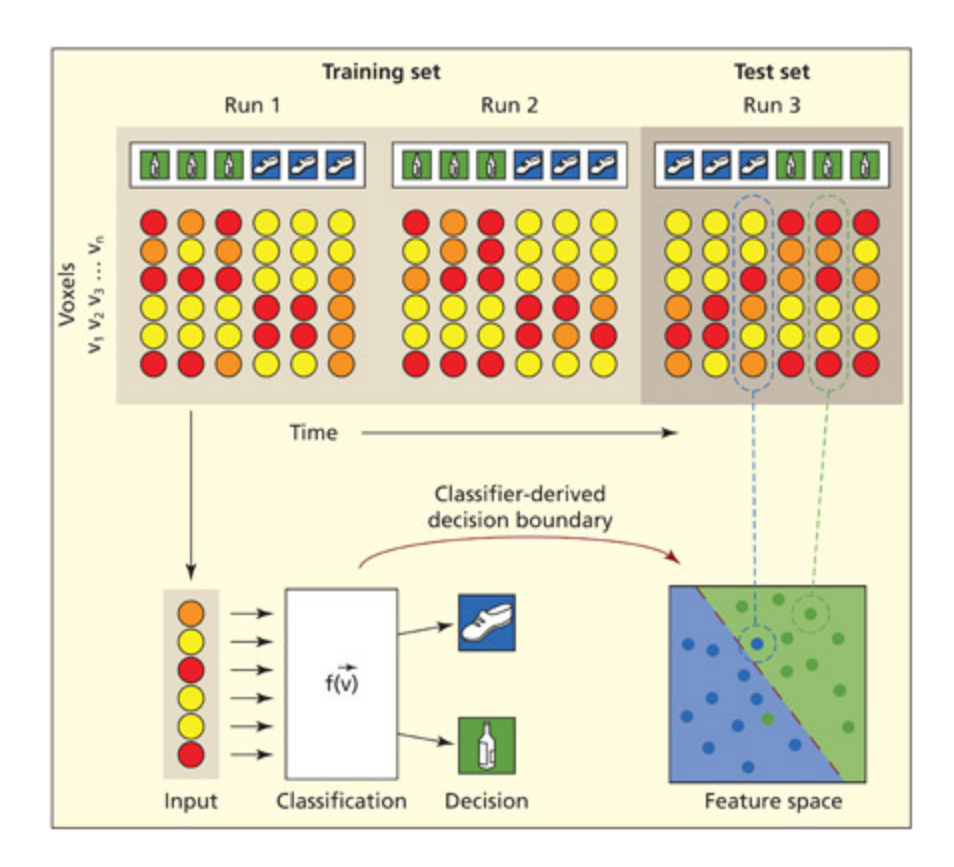
📊 그림 설명
다중 복셀 패턴 분석(MVPA)의 실험 설계 구조를 도식화한 그림이다. 훈련 단계에서 참가자에게 특정 자극(예: 병, 신발)을 제시하고 분류 알고리즘이 voxel 활성화 패턴을 학습한 후, 테스트 단계에서 새로운 자극에 대해 분류기가 카테고리를 예측한다. 이 과정은 참가자의 마음/뇌를 효과적으로 “읽는” 방식으로, 기존 fMRI 분석의 피크 영역 탐지와 달리 분산된 패턴을 활용한다.
In MVPA experimental designs, participants are given certain tasks or stimuli (in this example seeing boles or shoes) and a mathematical algorithm (a “classifier”) trains itself to optimally discriminate between them based on the paern of activity in the voxels (note: the actual spatial arrangement of voxels isn’t crucial). In the next phase (testing), the participant is then given more tasks or stimuli (e.g. new images of shoes) and the algorithm must classify them. In this phase the participant’s mind/brain is effectively being “read.”
Adapted from Norman et al., 2006.
e studies described thus far are limited in that they generate answers from a closed set of options (e.g. shoe compared with bole). However, other studies have used this approa to generate an open ended set of responses.
e primary visual cortex (also termed V1) has a particular functional layout su that it is a mosaic of small regions that are specialized for detecting lines of certain orientations and also for detecting light in particular locations. e grid of voxels used in fMRI may capture some of this paerning, and aempts have been made to reconstruct visual images (presented to a participant) based on the paern of activity in this region. For instance, Miyawaki et al. (2008) used a 10 · 10 grid of pixels to train a classifier. Just as the classifier can sear for voxels that “prefer” shoes over boles, one can do the same for voxels that prefer brightness in, say, the top le of the grid as opposed to boom right or for voxels that prefer horizontal over vertical orientations. From this simple training, it was possible to reconstruct leers and words that were presented to the participants. Aempts at generating more complex images using this method have more limited success but are good at finding a close mat to a novel image from within a large database (Naselaris et al., 2009).
Key Terms
Vegetative state
A disorder of consciousness in whi patients with severe brain damage are in a state of partial arousal.
식물인간 상태는 중증 뇌 손상 환자가 부분적 각성 상태에 있는 의식 장애로, fMRI를 통한 상상 기반 작업으로 간접적 의사소통이 가능할 수 있음이 밝혀졌다.
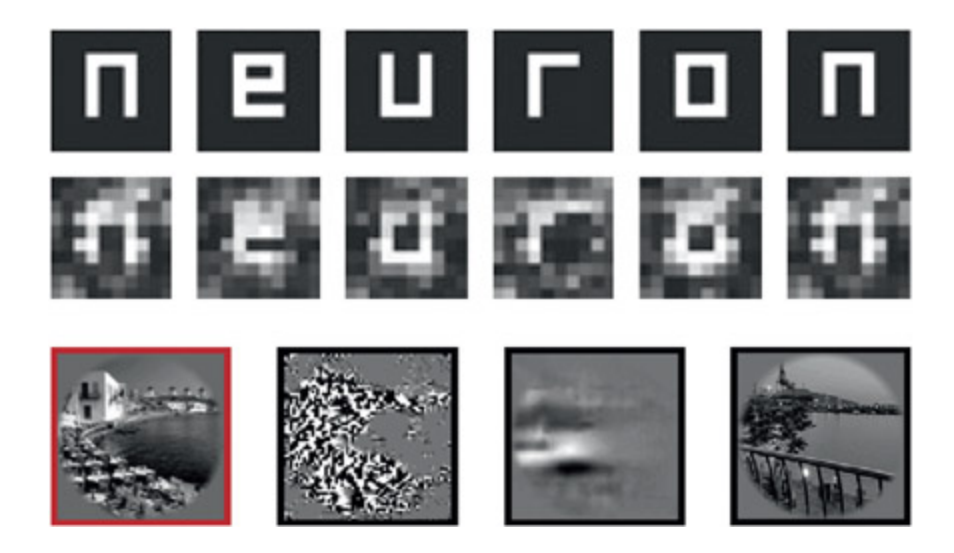
📊 그림 설명
뇌 활동 패턴으로부터 시각 이미지를 재구성하는 연구 결과를 보여주는 그림이다. 상단에는 10x10 격자에 표시된 글자를 voxel 활성화 패턴에서 복원한 Miyawaki et al.(2008)의 결과가, 하단에는 로컬 대비, 글로벌 특성, 600만 이미지 데이터베이스 매칭의 세 가지 방법으로 재구성을 시도한 Naselaris et al.(2009)의 결과가 제시된다. 전두엽 활성화 패턴으로 의사결정을 예측하거나, 식물인간 상태 환자와의 간접 의사소통에 활용하는 사례도 포함된다.
Can activity in the brain be used to reconstruct what image is being seen? In the top example, leers displayed in a 10 · 10 grid to the participants can clearly be read out from the paern of brain activity. In the boom example, the target image is shown on the le (red outline) and, to the right, are shown three aempts at image reconstruction from the paern of activity (bla outline). e first reconstruction uses an algorithm based on detecting local contrast. e second reconstruction uses the global (blurred) image aracteristics. e final aempt involves finding a best mat from a database of 6 million images (not including the target image).
Top, from Miyawaki et al., 2008. Boom, from Naselaris et al., 2009.
Mu of the discussion has focused on brain decoding of external inputs. What about intentions and decisions that are, by their nature, internally driven? Paerns of activity in the prefrontal cortex can be used to predict (even before the person made their response) whi of two tasks will be performed—in this study the decision was whether to add or subtract digits (Haynes et al., 2007). Brain activity when shown a series of goods predicts, above ance, subsequent purasing decisions (Knutson et al., 2007). Finally, a remarkable set of studies have been performed on patients in a vegetative state who, because of their condition, are unable to produce verbal or motor responses (Monti et al., 2010; Owen et al., 2006). Some of these patients are able to understand sentences by complying with instructions su as “imagine navigating around your house” or “imagine playing tennis”: these tasks have very different neural substrates related to spatial and motor imagery, respectively. Moreover, these different neural
signatures can be used as a simple substitute for communication to answer questions su as “Is your father’s name Alexander? (yes = imagine tennis, no = imagine your house).” As su, brain reading may ultimately have real clinical significance rather than being an instrument of a “Big Brother” state.
Evaluation
In summary, brain imaging can be used to infer the type of stimulus that is being processed and simple cognitive decisions (e.g. add or subtract). However, it is unclear whether fMRI will ever be able to infer the specific content of thought. To infer, for example, whether someone in a scanner is thinking about his or her own cat or next-door’s cat would require knowledge of how and where an individual stimulus is represented in the brain. We have all been exposed to different cats, houses, and so on during the course of our life. Moreover, all our brains differ in subtle ways. is presents a natural boundary on the imaging enterprise that tenological developments alone are unlikely to resolve.
Summary and Key Points of the Chapter
Summary
이 섹션에서는 구조적 영상(structural imaging)과 기능적 영상(functional imaging)의 차이점을 중심으로 설명하며, 구조적 영상은 뇌의 정적 해부학적 특성을 시각화하여 질병 진단에 유리한 반면, 기능적 영상은 뉴런 활동에 따른 혈류 변화와 산소 농도 변화를 측정하여 인지 기능과의 연관성을 탐구하는 데 초점을 맞춘다. 뉴런 활동은 혈액의 산소 소비를 유발하여 PET(양전자 방출 단층 촬영)와 fMRI(기능적 자기공명영상)를 통해 각각 혈류량 증가와 산소화되지 않은 헤모글로빈 변화로 반영되며, 이는 기능적 영상이 항상 생리적으로 활동적인 뇌의 상대적 변화를 측정해야 함을 시사한다. 기능적 영상 실험 설계의 기본 원리는 인지 차감(cognitive subtraction)으로, 특정 작업과 다른 작업 간의 뇌 활성화 차이를 비교하는 방식이며, 이 방법의 한계를 줄이기 위해 파라메트릭 디자인(parametric design)과 요인 설계(factorial design)가 활용된다. 개체 간 뇌 해부학적 차이로 인해 특정 영역을 정확히 매핑하는 것이 어려우며, 이를 해결하기 위해 스테레오타크틱 정규화(stereotactic normalization)와 스무딩(smoothing) 기법이 사용된다. 활성화 영역(activation regions)은 실험 조건 대비 기준 조건에서 대사량이 증가한 영역을 의미하지만, 이가 해당 작업의 필수적 요소임을 보장하지는 않으며, 손상 연구(lesion studies)가 이에 대한 증거를 제공할 수 있다. 기능적 영상은 사고나 감정 상태를 대략적으로 파악하는 데 활용될 수 있으나, 개인의 사고나 기억을 세밀하게 해석하는 데는 한계가 있으며, 전통적인 거짓말 탐지기보다 우월할 수 있지만, 정확한 사고 내용을 밝혀내는 것은 불가능하다.
-
Structural imaging reveals the static physical aracteristics of the brain (useful in diagnosing disease), whereas functional imaging reveals dynamic anges in brain physiology (that might correlate with cognitive function).
-
Neural activity consumes oxygen from the blood. is triggers an increase in blood flow to that region (measured by PET) and a ange in the amount of deoxyhemoglobin in that region (measured by fMRI).
-
As the brain is always physiologically active, functional imaging needs to measure relative anges in physiological activity. e most basic experimental design in functional
-
imaging resear is to subtract the activity in ea part of the brain while doing one task away from the activity in the same parts of the brain while doing a slightly different task. is is called cognitive subtraction.
-
Other methods, including parametric and factorial designs, can minimize many of the problems associated with cognitive subtraction.
-
ere is no foolproof way of mapping a point on one brain onto the putatively same point on another brain because of individual differences in structural and functional anatomy. Current imaging methods cope with this problem by mapping individual data onto a common standard brain (stereotactic normalization) and by diffusing regions of significance (smoothing).
-
A region of “activity” refers to a local increase in metabolism in the experimental task compared with the baseline, but it does not necessarily mean that the region is essential for performing the task. Lesion studies might provide evidence concerning the necessity of a region for a task.
-
Functional imaging can be used to make crude discriminations about what someone is thinking and feeling and could potentially outperform traditional lie detectors. However, it is highly unlikely that they will ever be able to produce detailed accounts of another person’s thoughts or memories.
Example Essay Questions
Summary
이 섹션에서는 fMRI(기능적 자기공명영상)의 작동 원리와 한계를 중심으로 생리학적 메커니즘(physiological processes)과 시간/공간 해상도(temporal and spatial resolution) 결정 요인을 탐구한다. BOLD 신호(Blood Oxygen Level-Dependent signal)는 뉴런 활동에 따른 혈류량 변화를 반영하며, 이는 산소 농도와 헤모글로빈 상태에 민감한 혈관 생성 기법(hemodynamic method)을 기반으로 작동한다. 시간 해상도는 HRF(Hemodynamic Response Function)의 지연과 지속 시간에 영향을 받고, 공간 해상도는 자석 강도(magnetic field strength)와 스무딩(smoothing) 처리 방식에 따라 달라진다. 또한, 인지 차감(cognitive subtraction) 기법의 한계를 다루며, 순수 삽입(pure insertion) 및 순수 삭제(pure deletion) 가정의 실질적 적용 가능성과 변수 간 상호작용(interaction) 문제를 지적한다. 기능적 영상(functional imaging)이 손상 연구(lesion studies)를 완전히 대체할 수 있는지에 대한 논의에서는, 필수성(necessity)와 충분성(sufficiency)의 구분, 참가자의 전략 선택, 작업 특성 등으로 인한 한계를 강조한다. 마지막으로, 뇌 활성화(activation)가 특정 작업의 필수 요소를 의미하지 않을 수 있음을 설명하며, 거짓 발견률(FDR) 교정과 같은 통계적 방법의 중요성을 언급한다. 뇌 활성화 영역(activation regions)의 해석은 BOLD 신호 변화와 통계적 유의성(statistical significance)을 기반으로 이루어지며, 이는 인지 과정(cognitive process)의 복잡한 메커니즘을 반영한다.
What are the physiological processes that underpin fMRI? What determines the temporal and spatial resolution of this method?
- What is meant by the method of “cognitive subtraction” in functional imaging resear? What problems does this method face?
- Is functional imaging ever likely to completely replace lesion methods for informing theories of cognition?
- If a brain region is shown to be “active” in a given task, does it mean that this region is critical for performing the task? If not, why not?
- Could functional imaging be used in lie detection? Could it be used to read someone else’s thoughts and feelings?

📊 그림 설명
이 장의 학습을 보완하기 위한 온라인 리소스 안내 이미지이다. 동반 웹사이트에서 주요 논문 참고문헌, Geoffrey Aguirre, Thomas Insel 등 저명 심리학자와의 비디오 강의 및 인터뷰, 객관식 문제와 플래시카드, 용어집 다운로드 등을 제공하여 기능적 뇌 영상 기법에 대한 이해를 심화할 수 있다.
Visit the companion website at www.psypress/cw/ward for:
- References to key papers and readings
- Video lectures and interviews on key topics with leading psyologists Geoffrey Aguirre, omas Insel and author Jamie Ward
- Multiple oice questions and interactive flashcards to test your knowledge
- Downloadable glossary
Recommended Further Reading
Summary
이 섹션에서는 기능적 자기공명영상(fMRI) 분야의 추가 학습을 위한 주요 참고서를 소개한다. 첫 번째 권고서는 Hueel, Song, McCarthy(2008)의 *Functional magnetic resonance imaging (2nd edition)*로, Sinauer Associates에서 출판된 이 책은 내용이 체계적이면서도 일반 독자에게 접근성이 높아 기초 이해를 위한 적합한 자료로 추천된다. 두 번째는 Jezzard, Mahews, Smith(2001)의 Functional MRI: An introduction to methods로, Oxford University Press에서 발행한 이 책은 수학적 및 물리적 원리를 깊이 다루고 있어 기초 지식이 풍부한 독자나 fMRI의 이론적 기반을 원하는 연구자에게 적합하다. 마지막으로, Poldra, Mumford, Niols(2011)의 Handbook of functional MRI data analysis는 Cambridge University Press에서 출간된 실용적인 가이드로, fMRI 데이터 분석의 실제 적용을 학습하고자 하는 연구자에게 특히 유용하다. 이들 참고서는 초보자부터 전문가까지 다양한 수준의 독자를 고려해, fMRI 기술의 이론부터 실무까지 포괄적으로 다루며, 해당 분야의 핵심 지식을 체계적으로 습득할 수 있도록 구성되었다.
Hueel, S. A., Song, A. W., & McCarthy, G. (2008). Functional magnetic resonance imaging (2nd edition). Sunderland, MA:
- Sinauer Associates. orough but generally accessible. is is recommended for the general reader.
- Jezzard, P., Mahews, P. M., & Smith, S. M. (2001). Functional MRI: An introduction to methods. Oxford, UK: Oxford University Press. An advanced text that is only recommended to those who have a very good understanding of the basics, or those who wish to know more about the math and physics of fMRI.
- Poldra, R. A., Mumford, J. A., & Niols, T .E. (2011). Handbook of functional MRI data analysis. Cambridge, UK: Cambridge University Press. For those geing hand-on experience of fMRI resear.