029 - Bootstrapping Main Ideas!!!
신약 개발 중 약효 test를 해본다고 가정해보자.
약을 8명의 확진자들에게 줄 거다.

이 5명의 사람들은 약효가 있다고 판단했고, 나머지 3명은 회의적이었다.
Transclude of Bootstrapping_Main_Ideas_Notes_Screenshot_(1.png)
평균을 구해보면, 0.5인데, 이는 큰 효과는 아니다.
하지만, 명 수로 보면 5/8이 호전되었다고 느끼기 때문에 약을 아무것도 먹지 않는 것보다는 나을거다.
Transclude of Bootstrapping_Main_Ideas_Notes_Screenshot_(3.png)
하지만, 만약 5명의 사람들이 점점 건강해져서 후한 점수를 준것이고, 3명은 불건강한 생활로 인해 나쁜 점수를 준 것이라면,
즉, 우리가 통제하지 못하는 변인에 의해 점수가 산정된 것이라면, 점수를 해석하는데 신중해야 한다.
Transclude of Bootstrapping_Main_Ideas_Notes_Screenshot_(4.png)
어떻게 해야 더 잘 할 수 있을까?
-
반복 실험.
Transclude of Bootstrapping_Main_Ideas_Notes_Screenshot_(5
.png)반복하여 평균 값을 계속 추적한다면,
이렇게 평균 값들을 모은 histogram을 얻을 수 있을 것이다.
Transclude of Bootstrapping_Main_Ideas_Notes_Screenshot_(6
.png)보이는 것처럼, 평균은 0에 가깝고, 효능이 없어 보인다.
- 근데 이 방법은 돈과 시간이 너무 많이 든다.
-
Bootstrapping


Transclude of Bootstrapping_Main_Ideas_Notes_Screenshot_(1
1.png)Transclude of Bootstrapping_Main_Ideas_Notes_Screenshot_(2
.png)Transclude of Bootstrapping_Main_Ideas_Notes_Screenshot_(3
1.png)Transclude of Bootstrapping_Main_Ideas_Notes_Screenshot_(4
1.png)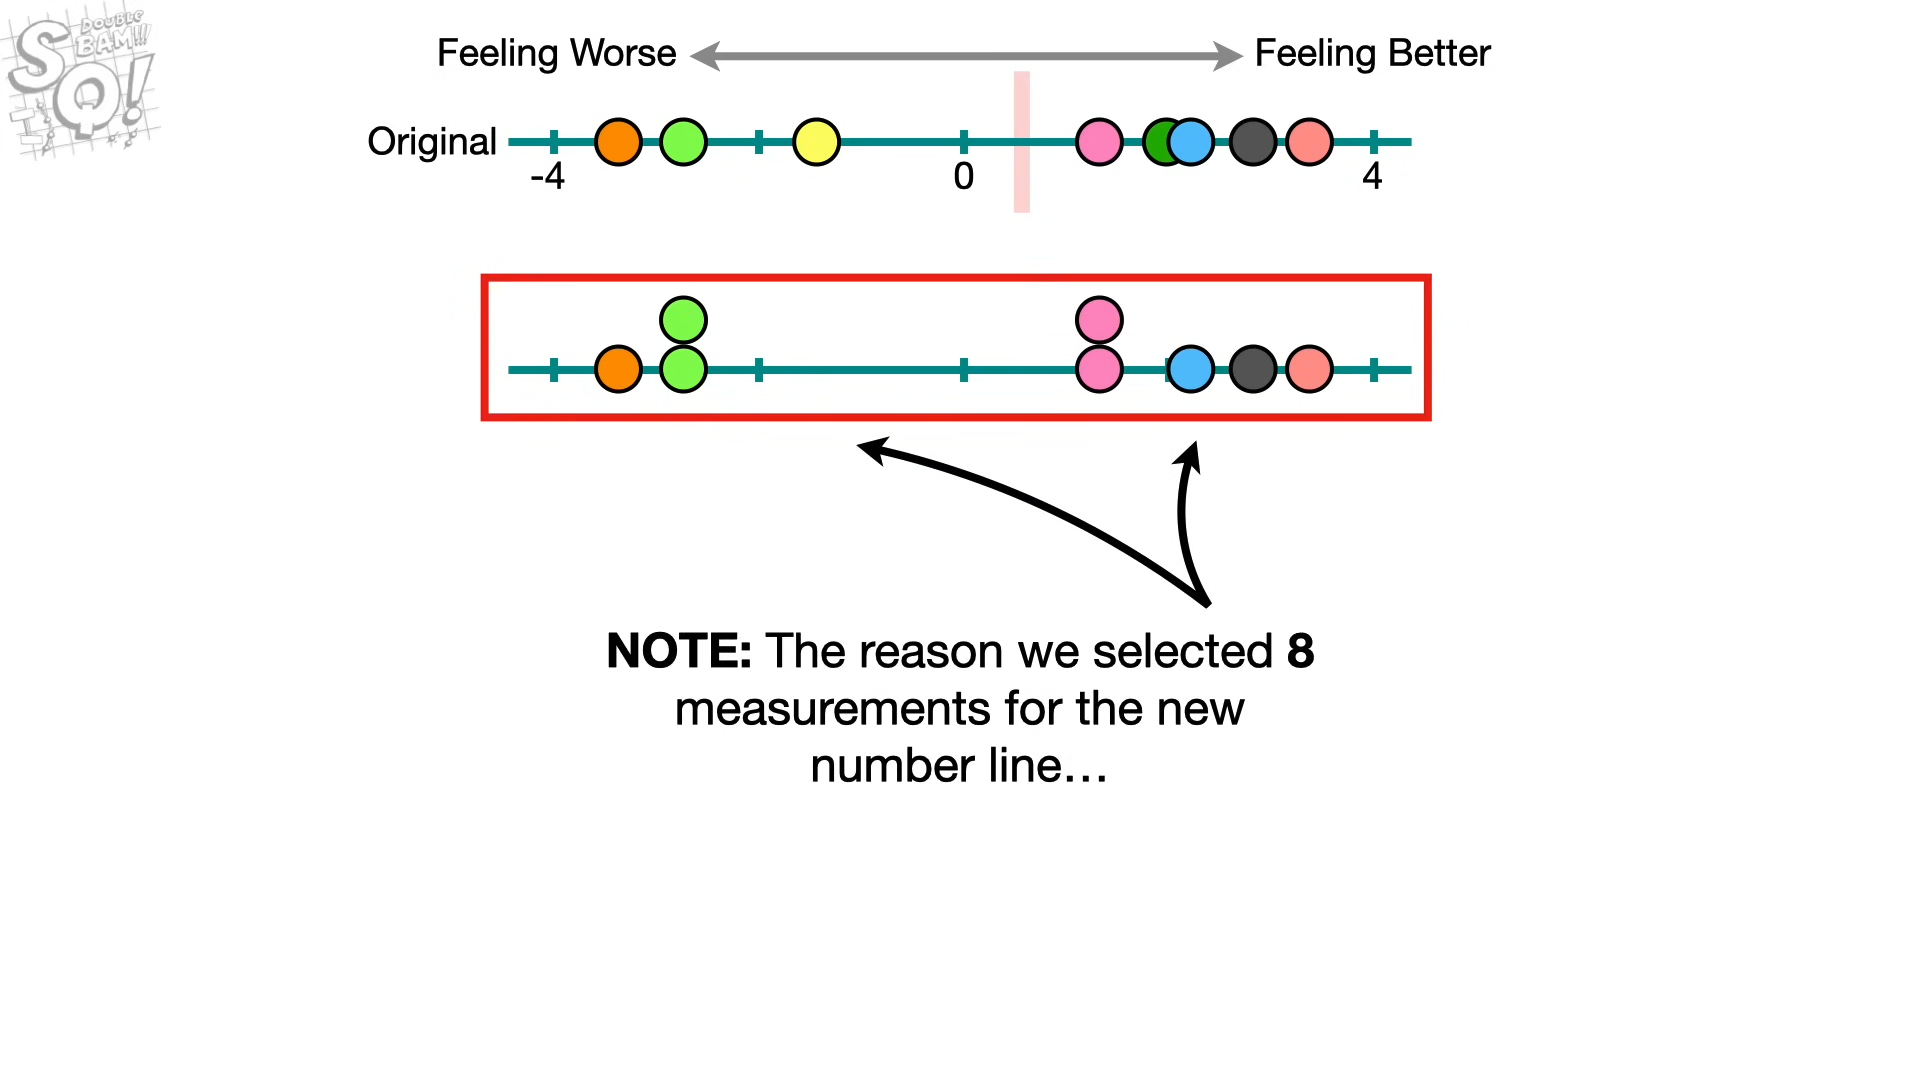
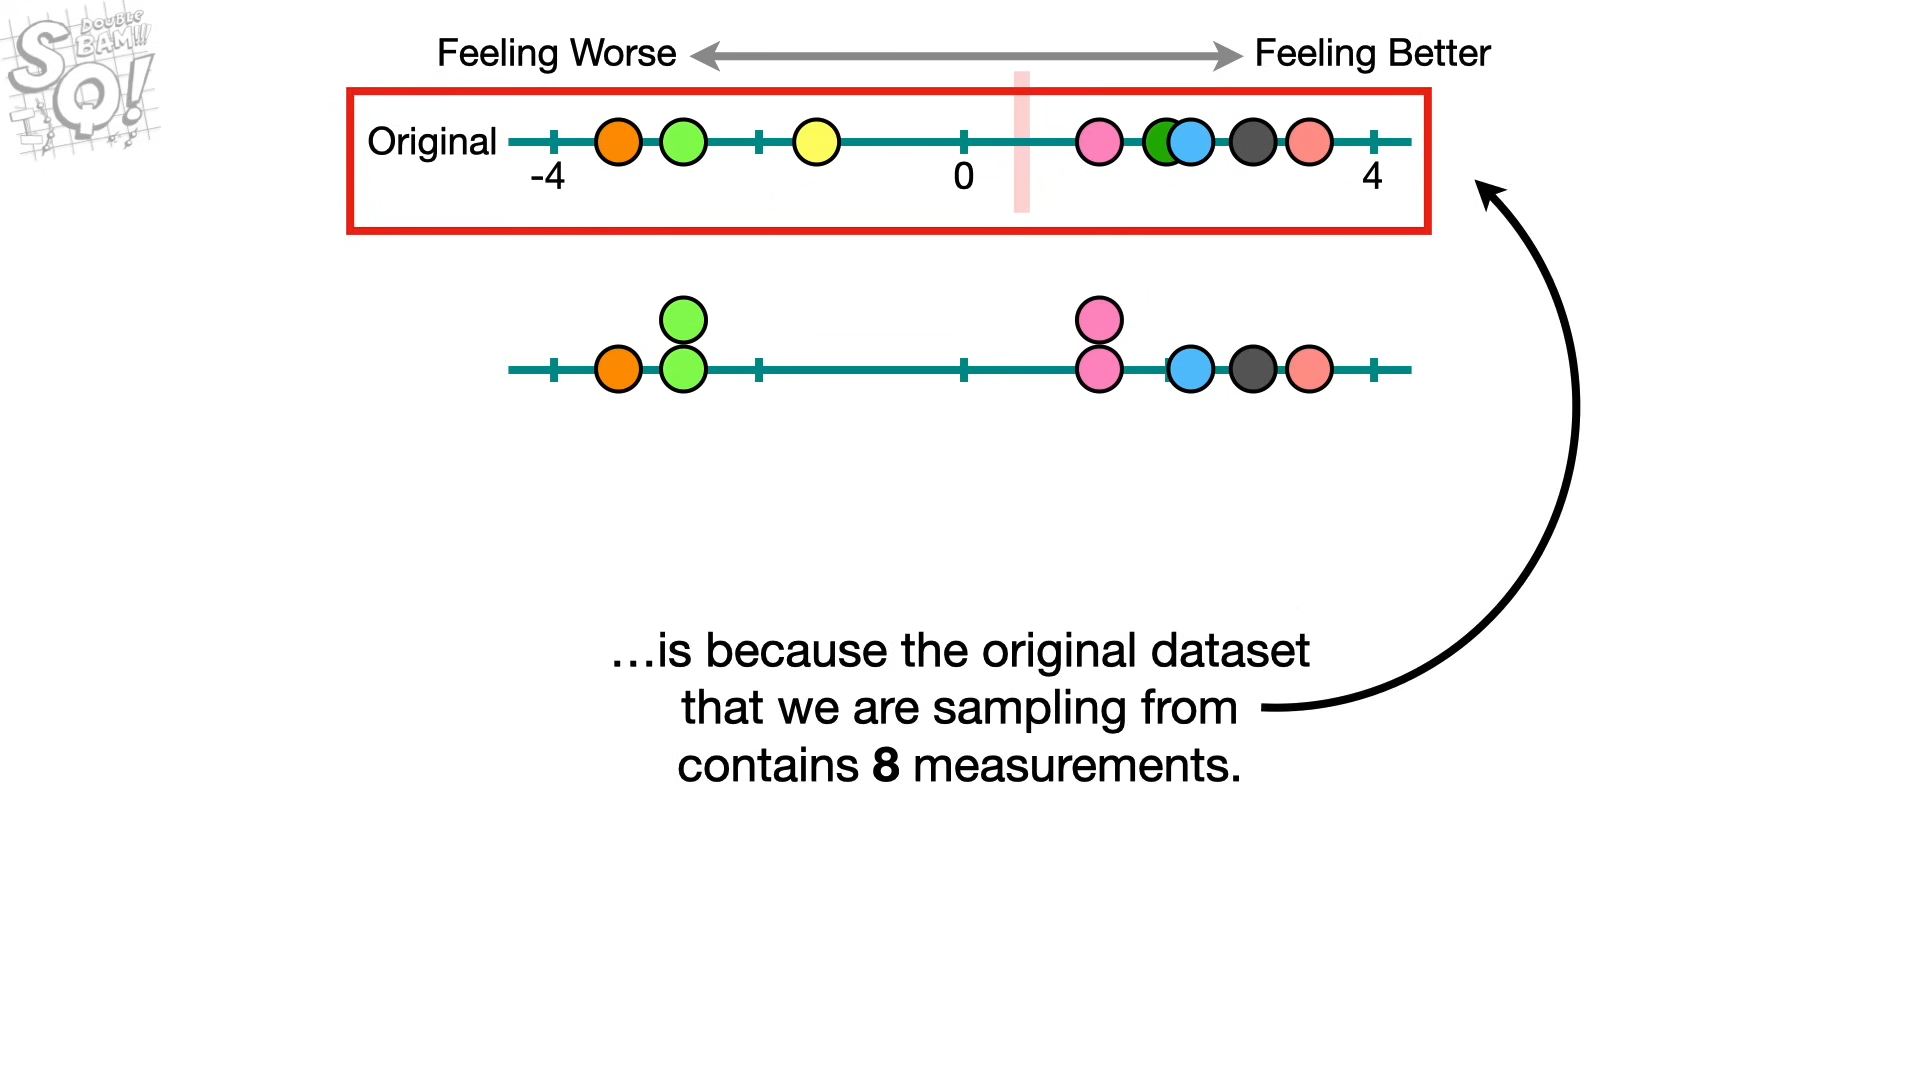
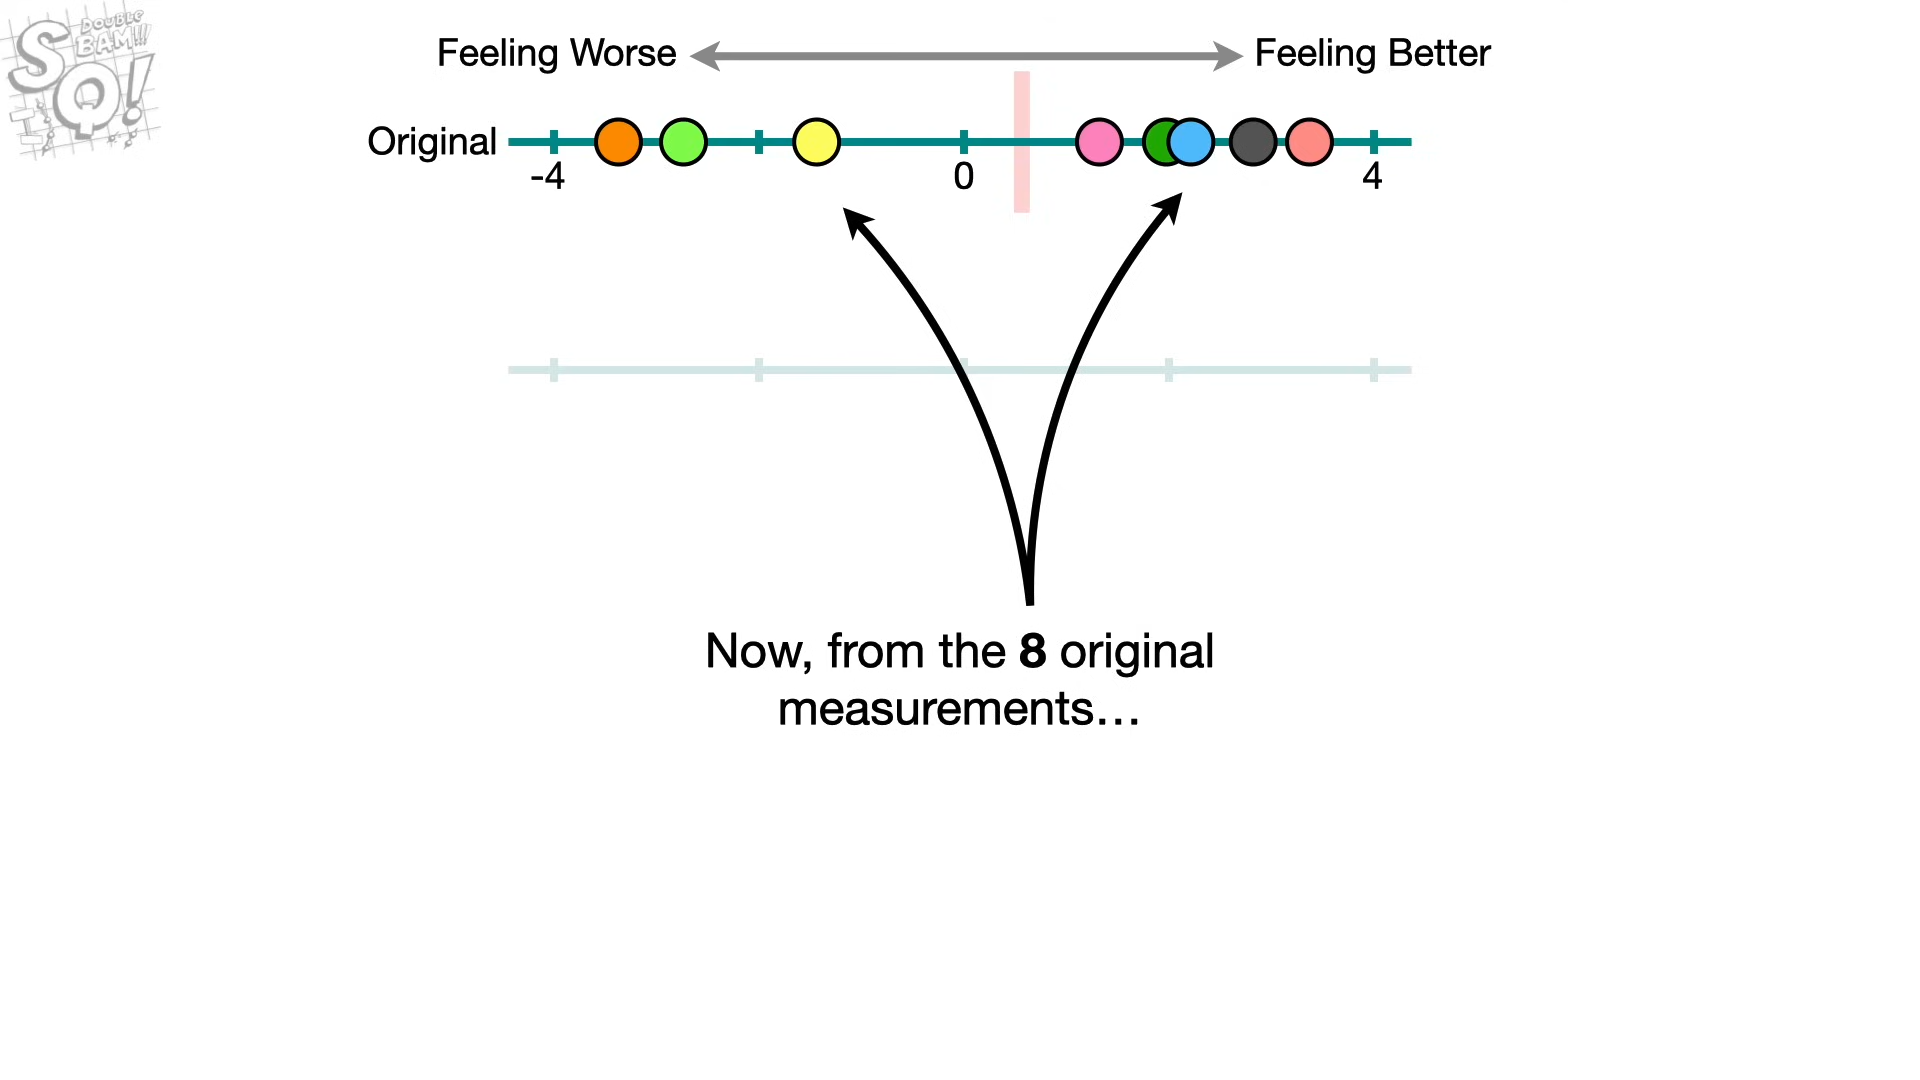
8개를 추출하는 것은 원본 셋이 8개라서 → 만약 원본으 크기가 10개였다면, 10으로..
이 새로운 셋을 부트스크랩 데이터셋이라 한다. → 원본 데이터랑 다르니, 평균도 다르겠지.
이제 이 평균을 이용해서 histogram을 그리면, (여러번의 부트스트랩핑 e.g. 1000번)Transclude of Bootstrapping_Main_Ideas_Notes_Screenshot_(5
1.png)이런 식으로 분포가 나오고,
Transclude of Bootstrapping_Main_Ideas_Notes_Screenshot_(6
1.png)Transclude of Bootstrapping_Main_Ideas_Notes_Screenshot_(7
.png)standard error를 알고 싶다면,
Transclude of Bootstrapping_Main_Ideas_Notes_Screenshot_(8
.png)여기의 std을 계산하면 된다.
Transclude of Bootstrapping_Main_Ideas_Notes_Screenshot_(9
.png)이 경우에는, 95% interval이 0을 cover해서 영가설 기각이 불가능. → 약효가 없는 것으로 판단.
Transclude of Bootstrapping_Main_Ideas_Screenshot_(1
.png)근데 사실, bootstrapping 안 해도, confidence interval이랑 std error를 구할 수 있긴 한데, 어떠한 점에서 이점이 있을까?
Transclude of Bootstrapping_Main_Ideas_Notes_Screenshot_(10
.png)→ 바로 중간에 계산하는 값이 굳이 평균이 아니어도 된다는 점이다. 중간에 histogram에 들어갈 값을 평균을 계산했지만, 이 위치에서 다른 statistic 값을 계산하여도 과정 상 문제될 게 없다.
→ 유연하다!