035 - R-squared, Clearly Explained!!!

R: 상관계수로 , 두 변수간 얼마나 상관이 있는지 알려주는 값(-1 ~ 1)
양 극단에 가까워질수록 상관의 크기는 크고, 부호는 방향을 의미.


id 축을 연속적이게 만들어볼까? → 축을 크기로 설정.
Transclude of R-squared_Explained_Screenshot_(1.png)
Transclude of R-squared_Explained_Screenshot_(2.png)
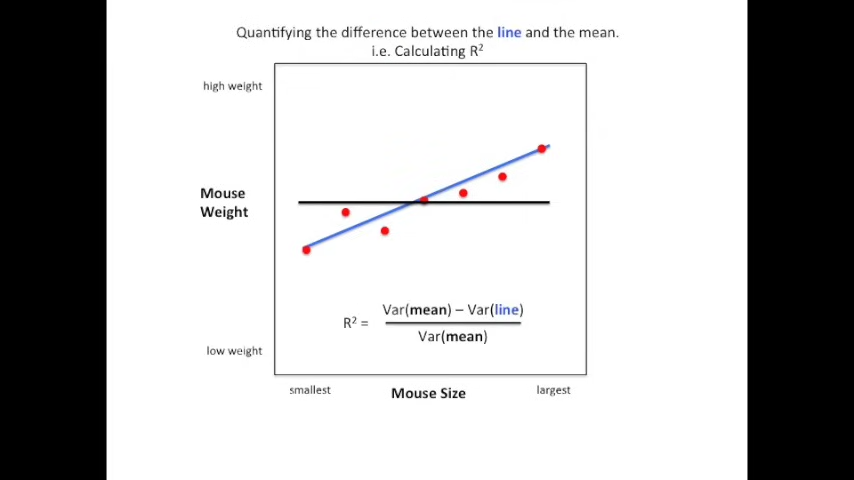
축 하나에 더 유의미한 정보를 부여함으로써 더 데이터를 잘 설명할 방법이 생겼다.
→ line을 그리자. (trend를 보겠다는 거지.)

새로운 line은 평균보다 데이터를 더 잘 설명하는가? 그렇다면, 얼마나 더 잘 설명하는데?
→


그림에서 볼 수 있듯이, y 값 차로 계산한다는 점을 명심!
Transclude of R-squared_Explained_Screenshot_(11.png)
로 표현하기도 함.
→ 모델이 variance, RSS를 줄이면 줄일수록, 더 데이터를 잘 설명할 수록, R^2값이 1에 근접.
Transclude of R-squared_Explained_Screenshot_(21.png)
Transclude of R-squared_Explanation_Screenshot_(1.png)